
Overview
Usage Explorer provides a centralized view of BoldCreate usage across your organization. It enables administrators and team leads to understand, monitor, and optimize BoldCreate usage, track token consumption, and adoption through detailed insights, compare performance with previous periods, filter data, export reports, and schedule automated reports for regular monitoring.
Purpose
The purpose of Usage Explorer is to:
- Provide visibility into BoldCreate usage and adoption.
- Track consumption across users, teams, models, and sessions.
- Analyze token consumption trends.
- Understand usage patterns across users, teams, sessions, and models.
- Compare usage and spending with the previous periods.
- Support reporting and decision-making through exports and scheduled reports.
Premium Model and Bring Your Own Key Usage
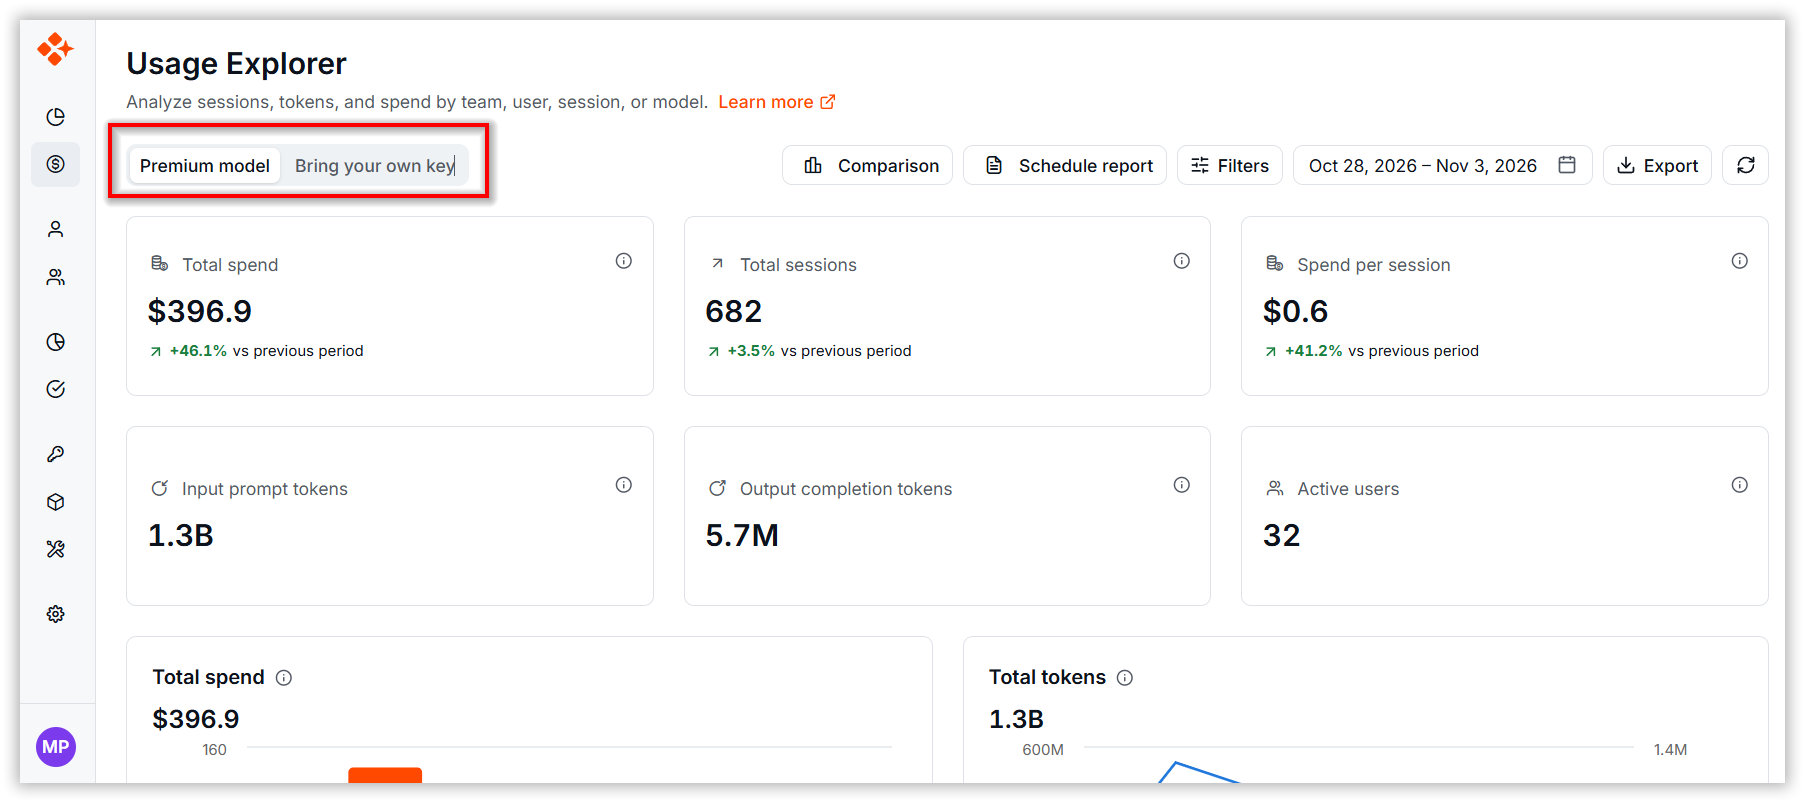
Open Usage Explorer under Analytics in the Dashboard sidebar. Use the Premium Model and Bring Your Own Key tabs to switch between usage of BoldCreate-provided models and usage through your organization’s own provider keys.
1. Usage Metrics
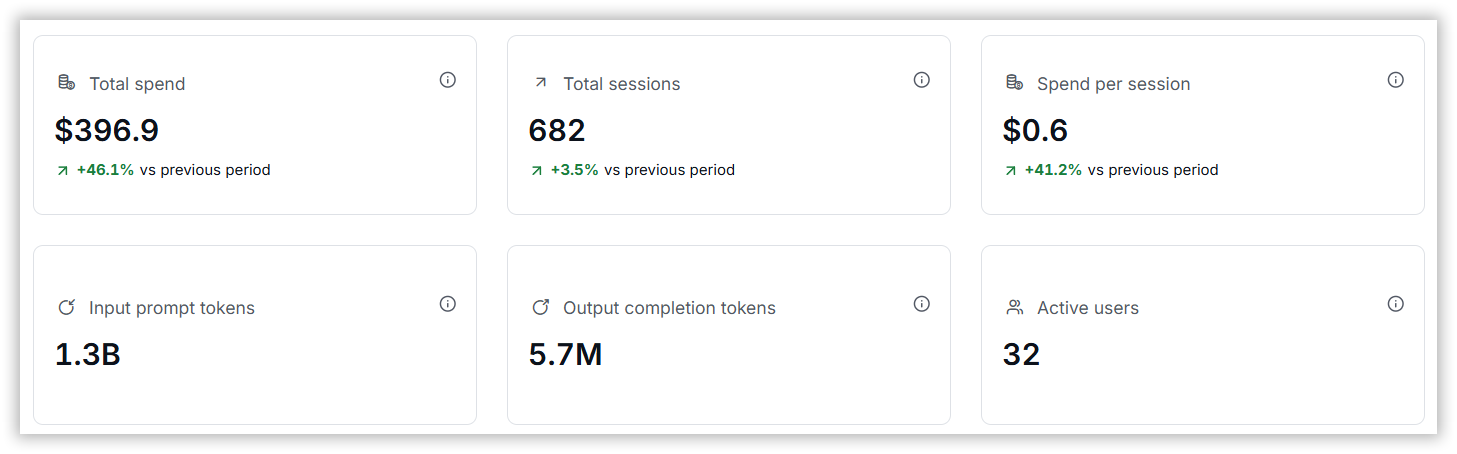
The Usage Explorer presents a visual summary of usage metrics and trends across the selected reporting period.
- Total Spend: Displays the total spend for the selected period.
- Total Tokens: Displays the total number of tokens consumed during the selected period.
- Total Sessions: Indicates the total number of sessions created during the selected period.
- Spend per Session: Displays the average spend per agent session during the selected period.
- Input Prompt Tokens: Displays the total prompt tokens processed across sessions in this period.
- Output Completion Tokens: Displays the total completion tokens generated across sessions in this period.
- Active Users: Displays the total number of users who actively used BoldCreate during the selected time period.
2. Graphical Overview
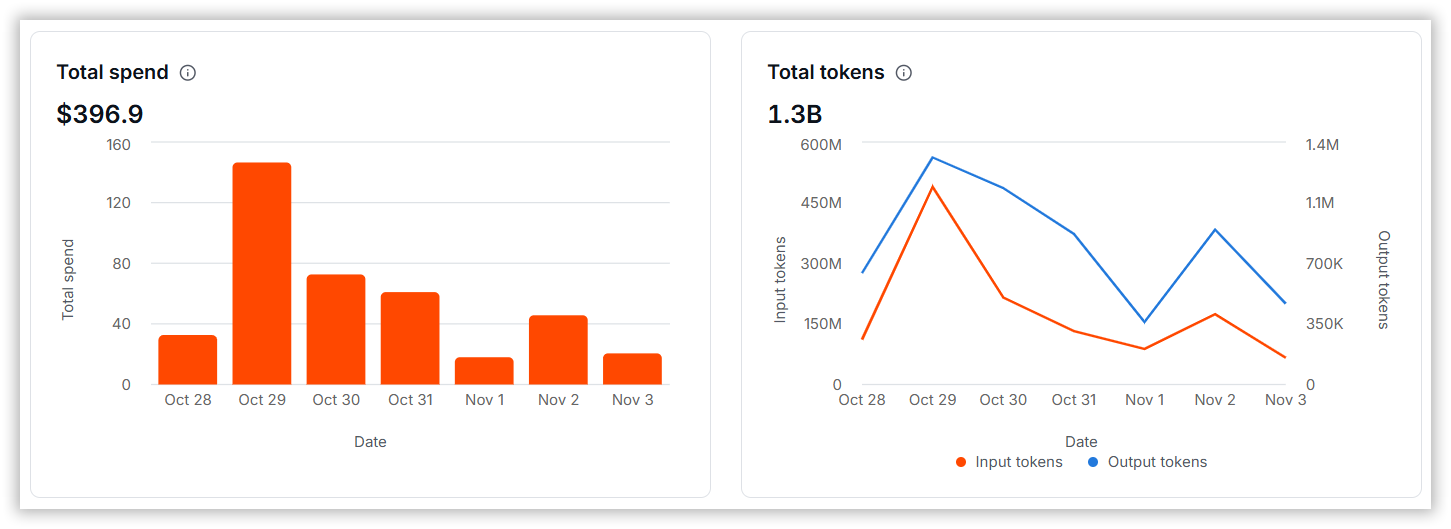
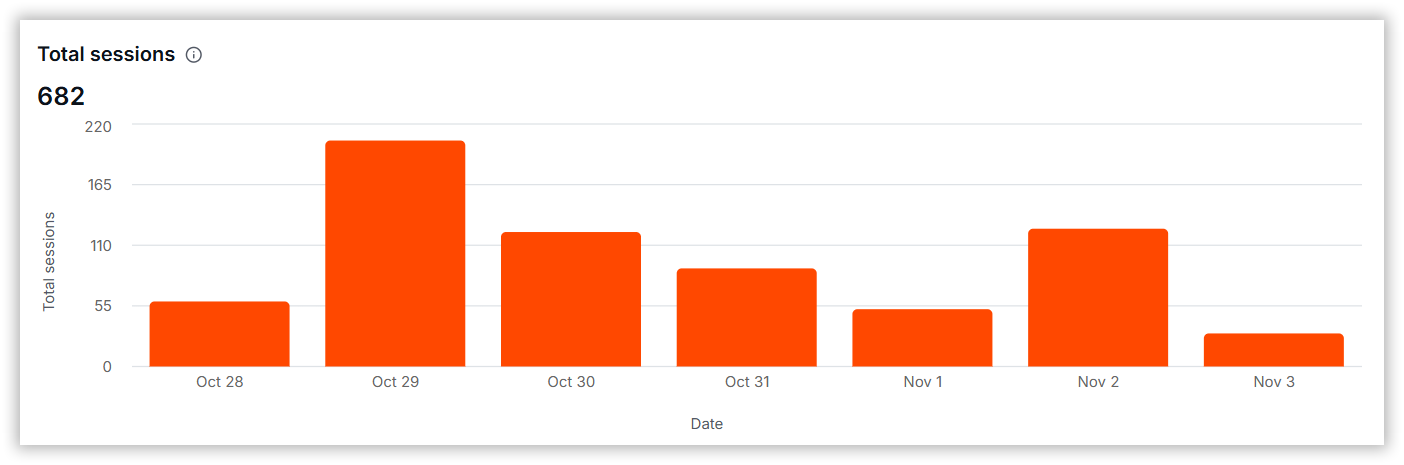
The Graphical Overview section provides visual representations of key usage metrics over the selected reporting period. These charts help administrators analyze spending patterns, token consumption trends, and session activity over time.
- Total Spend: Displays the total spend for the selected period.
- Total Tokens: Displays the total number of tokens consumed during the selected period.
- Total Sessions: Indicates the total number of sessions created during the selected period.
3. Detailed Usage Insights
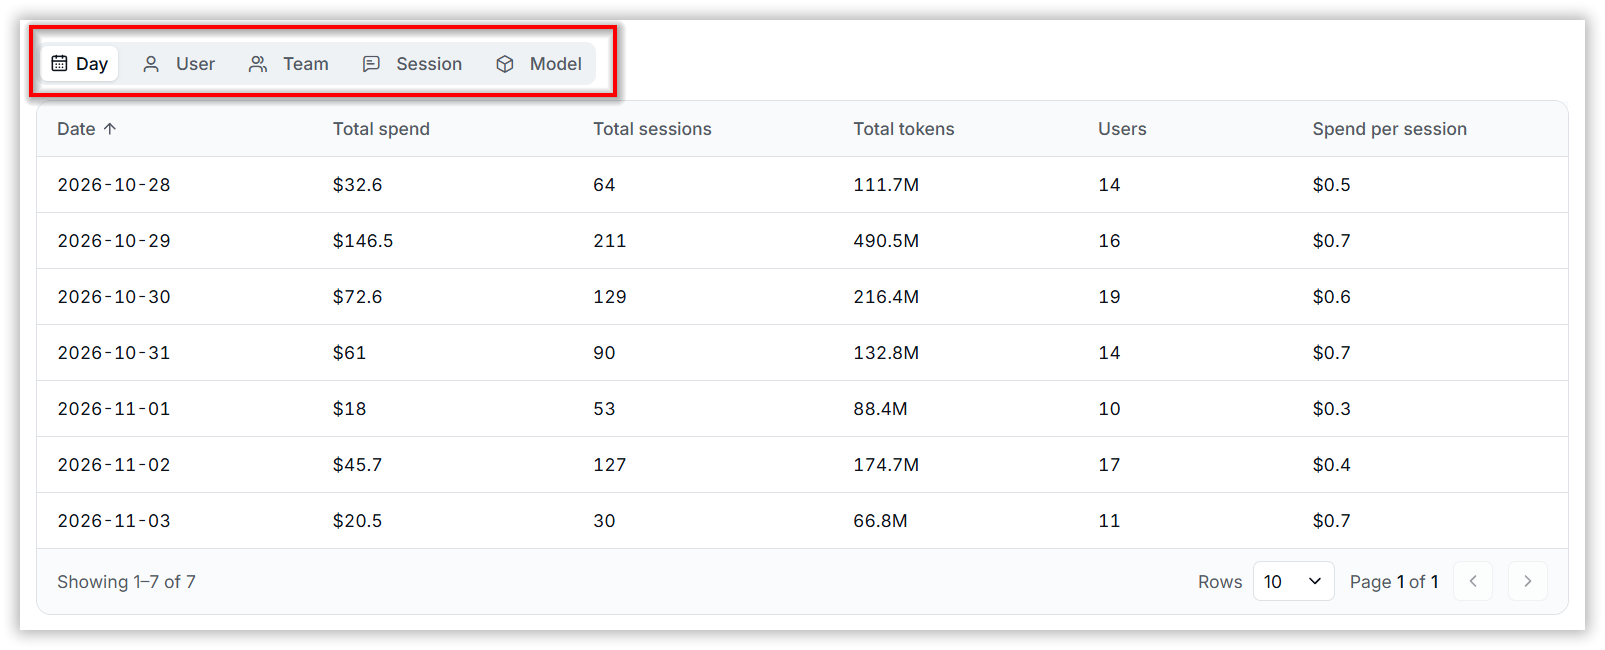
The Detailed Usage Insights section provides a comprehensive view of usage data, helping users understand how resources are consumed across the organization. It offers detailed insights into usage patterns and activity across different dimensions, enabling users to analyze trends and gain a deeper understanding of user, team, session, and model utilization.
This feature allows users to organize and view data based on the following categories:
- Day: Analyze daily usage and spending trends.
- User: Monitor individual user activity and consumption.
- Team: Evaluate team-level adoption and resource utilization.
- Session: Review usage data for specific chat sessions.
- Model: Understand consumption patterns and performance across models.
4. Filtering and Monitoring
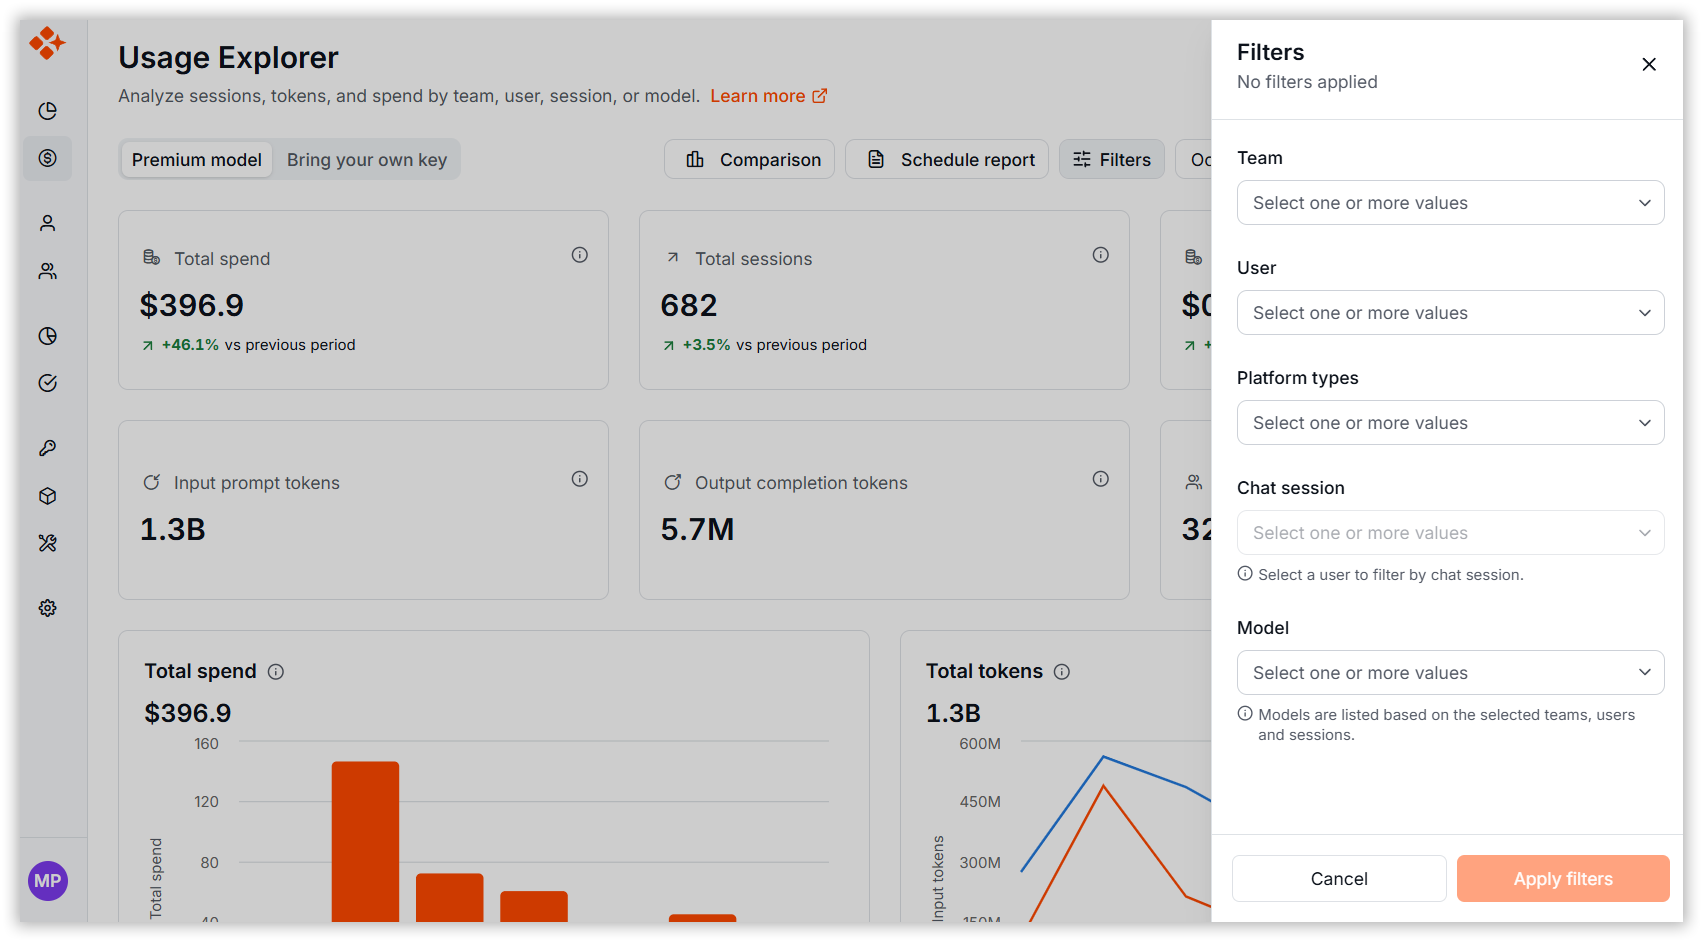
You can monitor:
- Team-specific Usage: Filter usage by individual teams.
- User-specific Usage: Filter usage by specific users.
- Session-specific Usage: Filter usage by individual sessions.
- Model-specific Usage: Filter usage by individual models.
5. Date Range Filtering
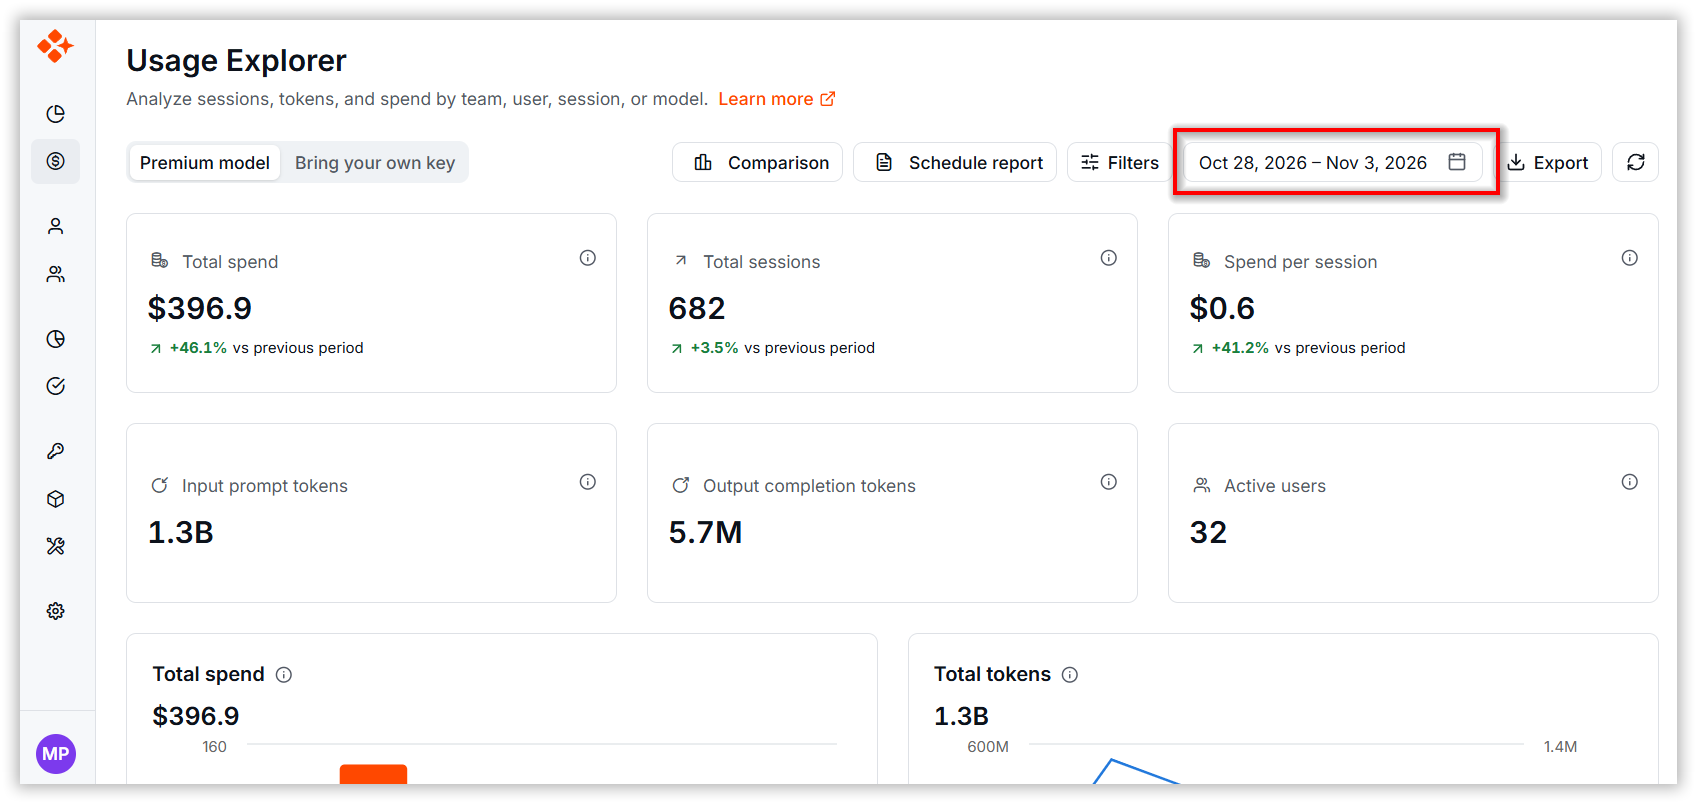
- Select predefined or custom date ranges to analyze token usage and other metrics over time.
- Useful for monthly reviews and performance analysis.
- All metrics and reports refresh automatically based on the selected period.
6. Comparison Report
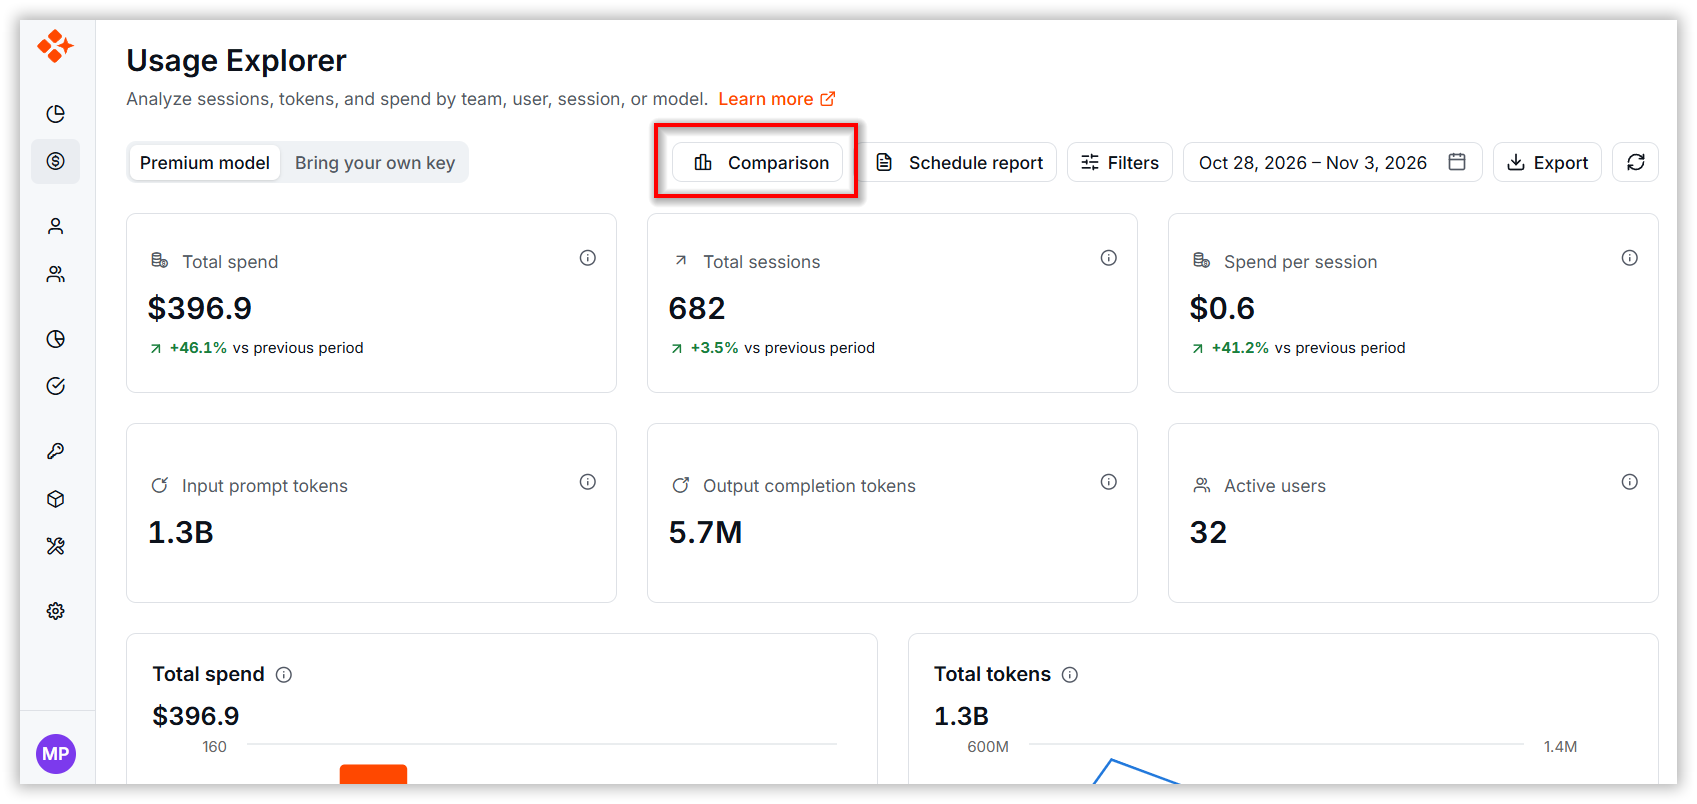
The Comparison feature allows users to compare usage and spending metrics for the selected date range against the previous equivalent period. This helps to monitor token consumption and evaluate organizational AI adoption over time.
6.1 Comparison Metrics
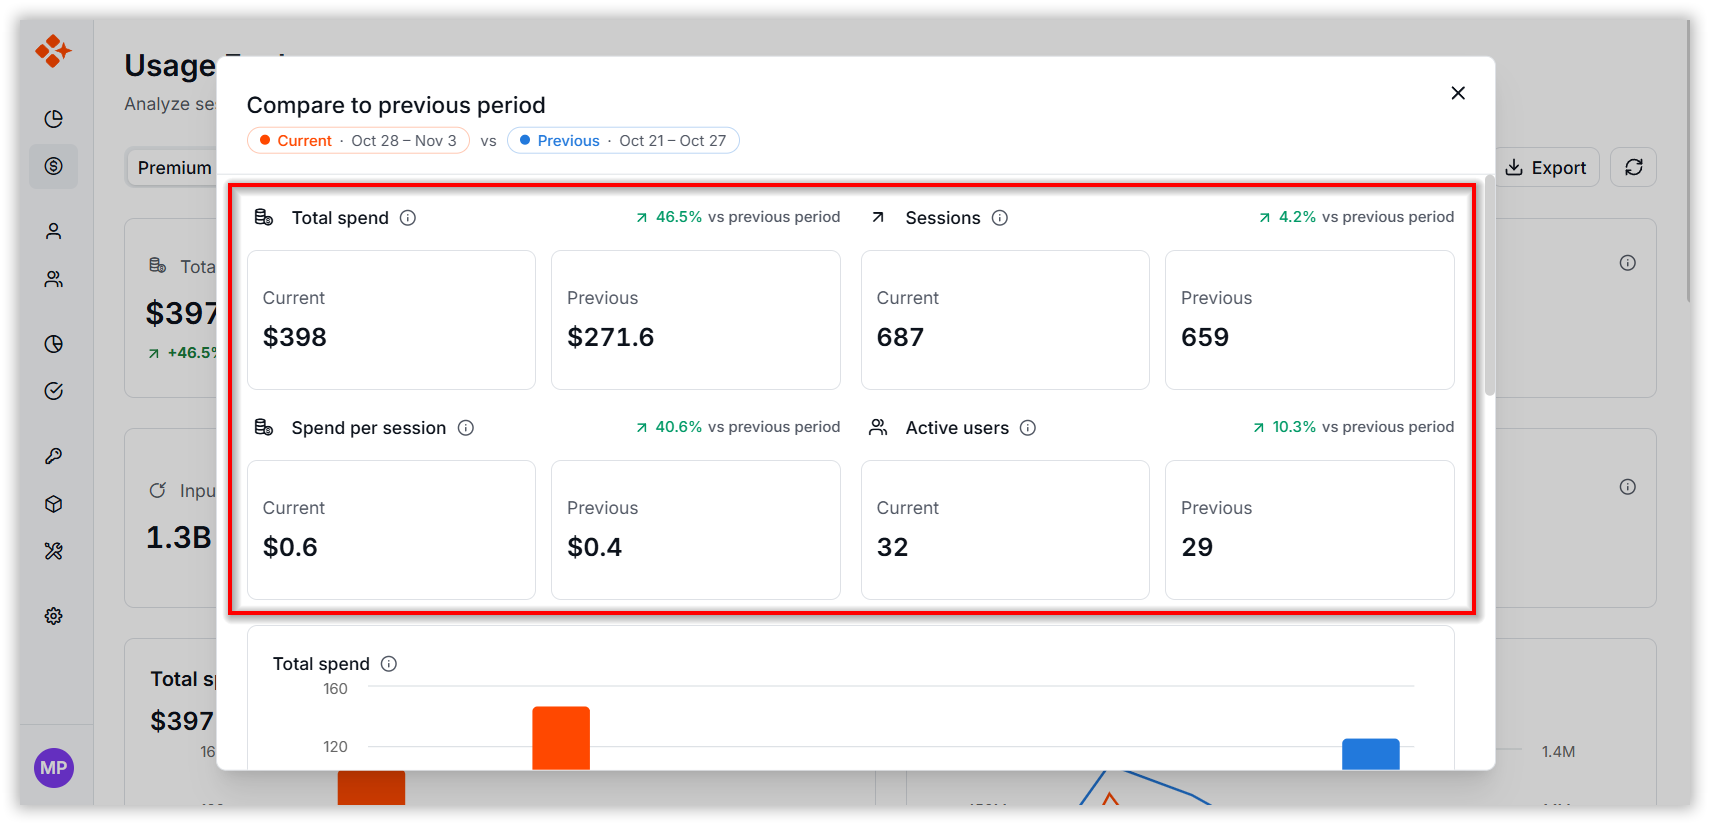
The comparison report displays usage metrics for the Current Period and Previous Period, enabling you to quickly analyze BoldCreate usage.
It includes the following key metrics:
- Total Spend: Total amount consumed during each period.
- Total Requests: Total number of AI requests processed during each period.
- Active Users: Number of users who actively used AI services during each period.
- Total Sessions: Number of AI sessions created during each period.
Each metric includes a percentage increase or decrease to quickly highlight changes in usage patterns.
6.2 Graphical Comparison
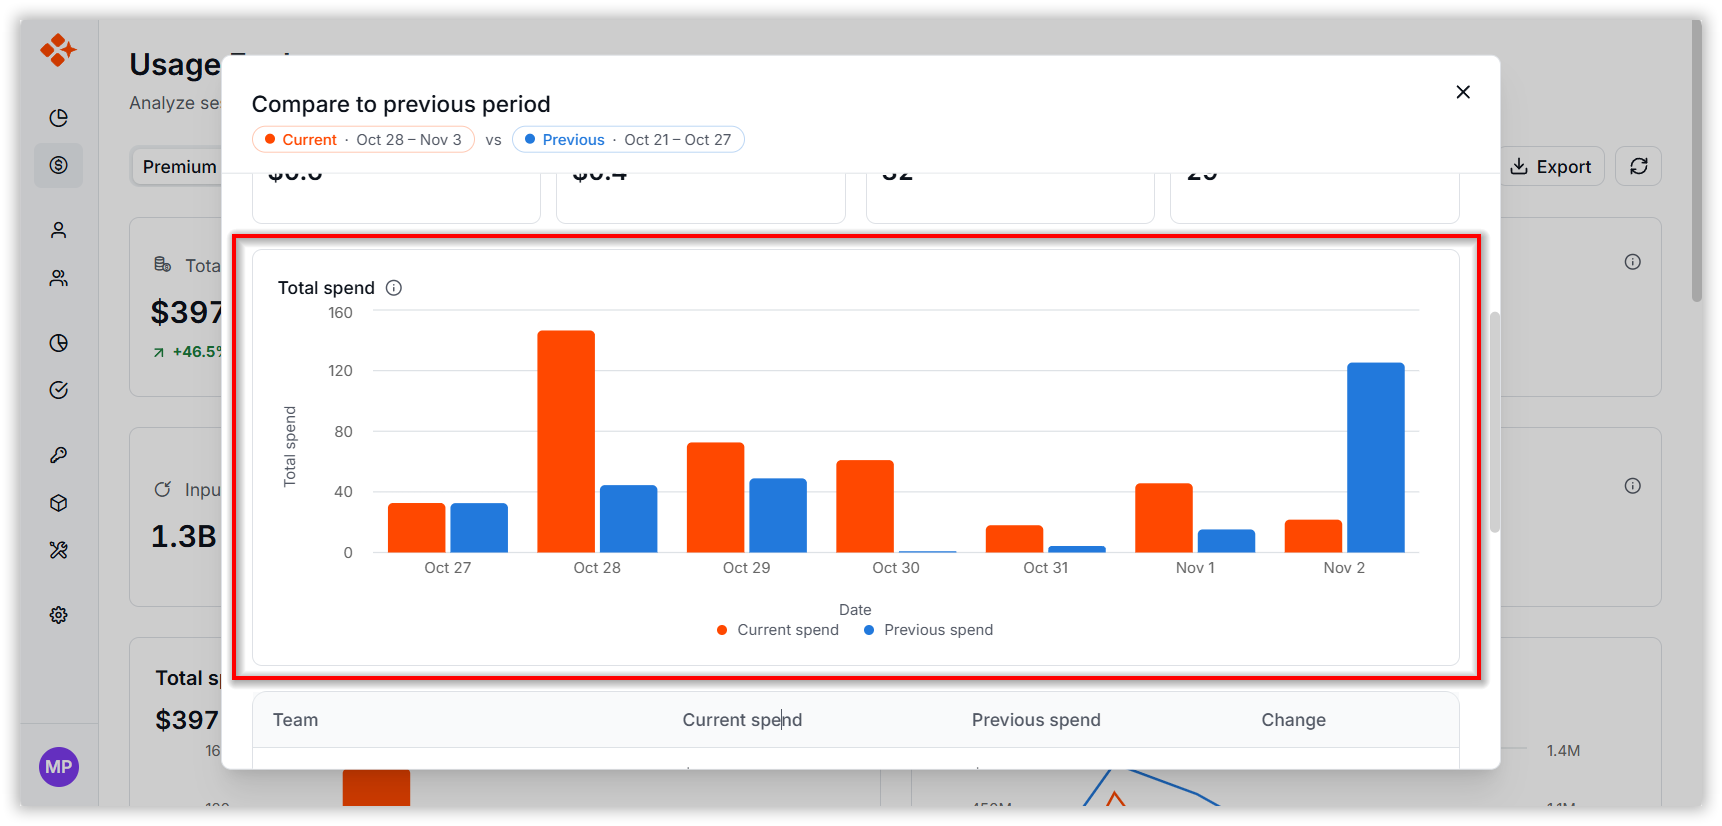
The report includes a visual chart comparing total spen for the selected and previous periods. The chart provides a quick and intuitive view of how usage has evolved over time.
6.3 Comparison Table
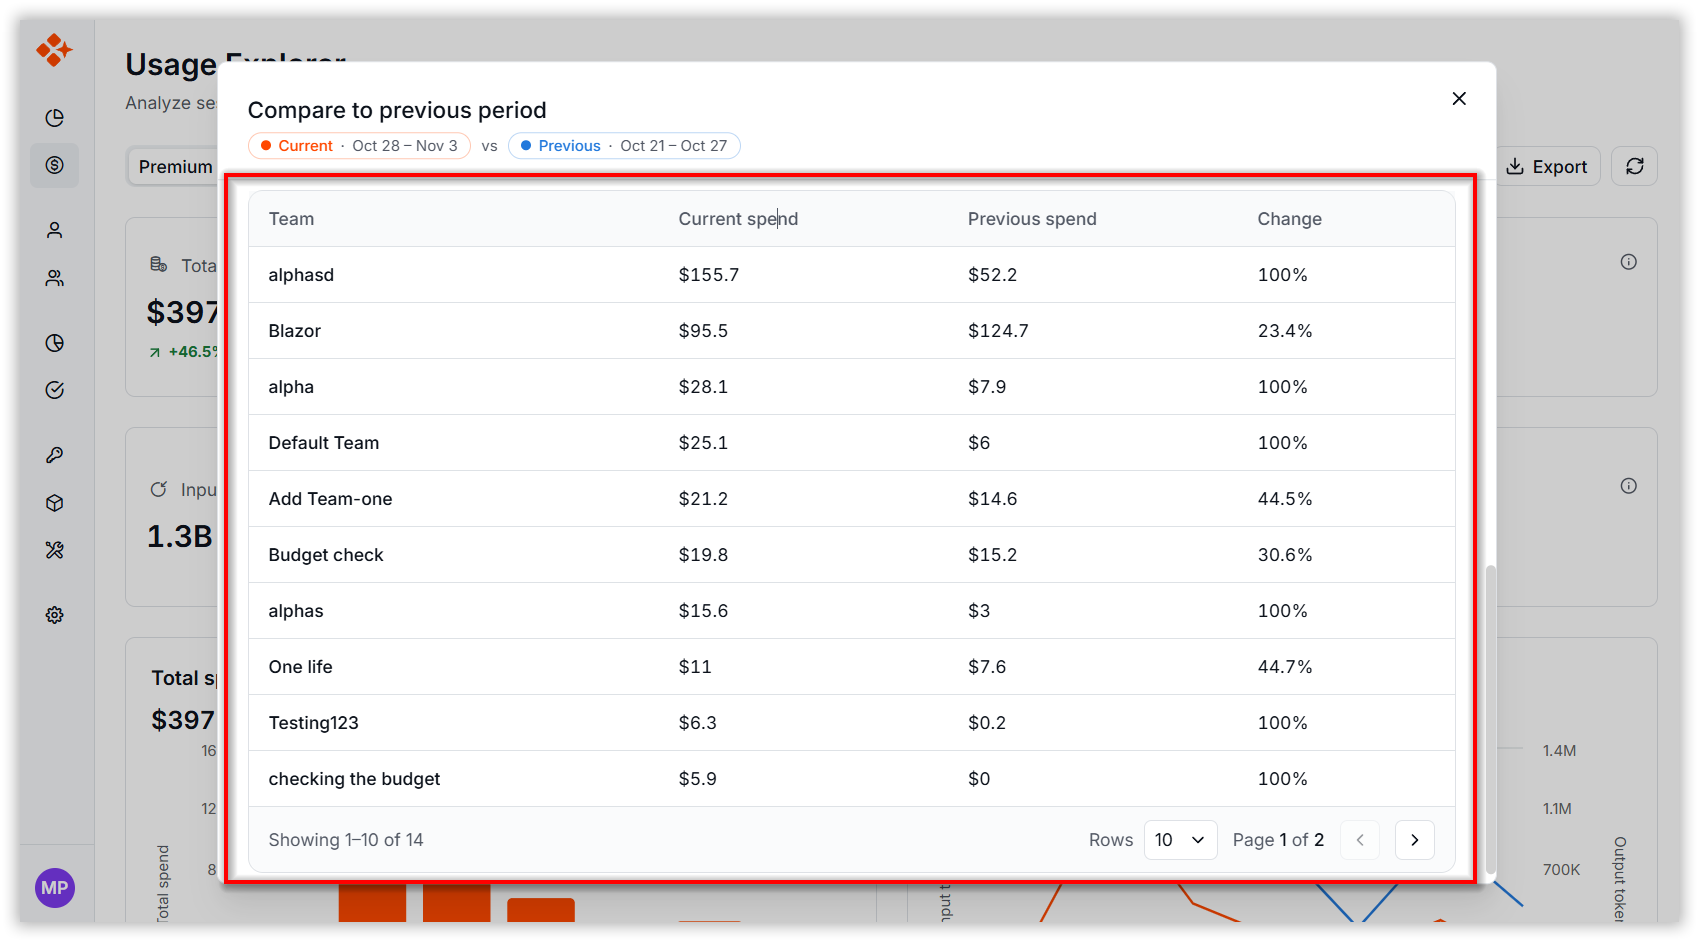
The comparison table provides a team-level breakdown of spending between the current and previous periods. This view helps administrators and team leads identify teams with the highest growth, reduced usage, or significant changes in AI consumption.
7. Schedule Reports
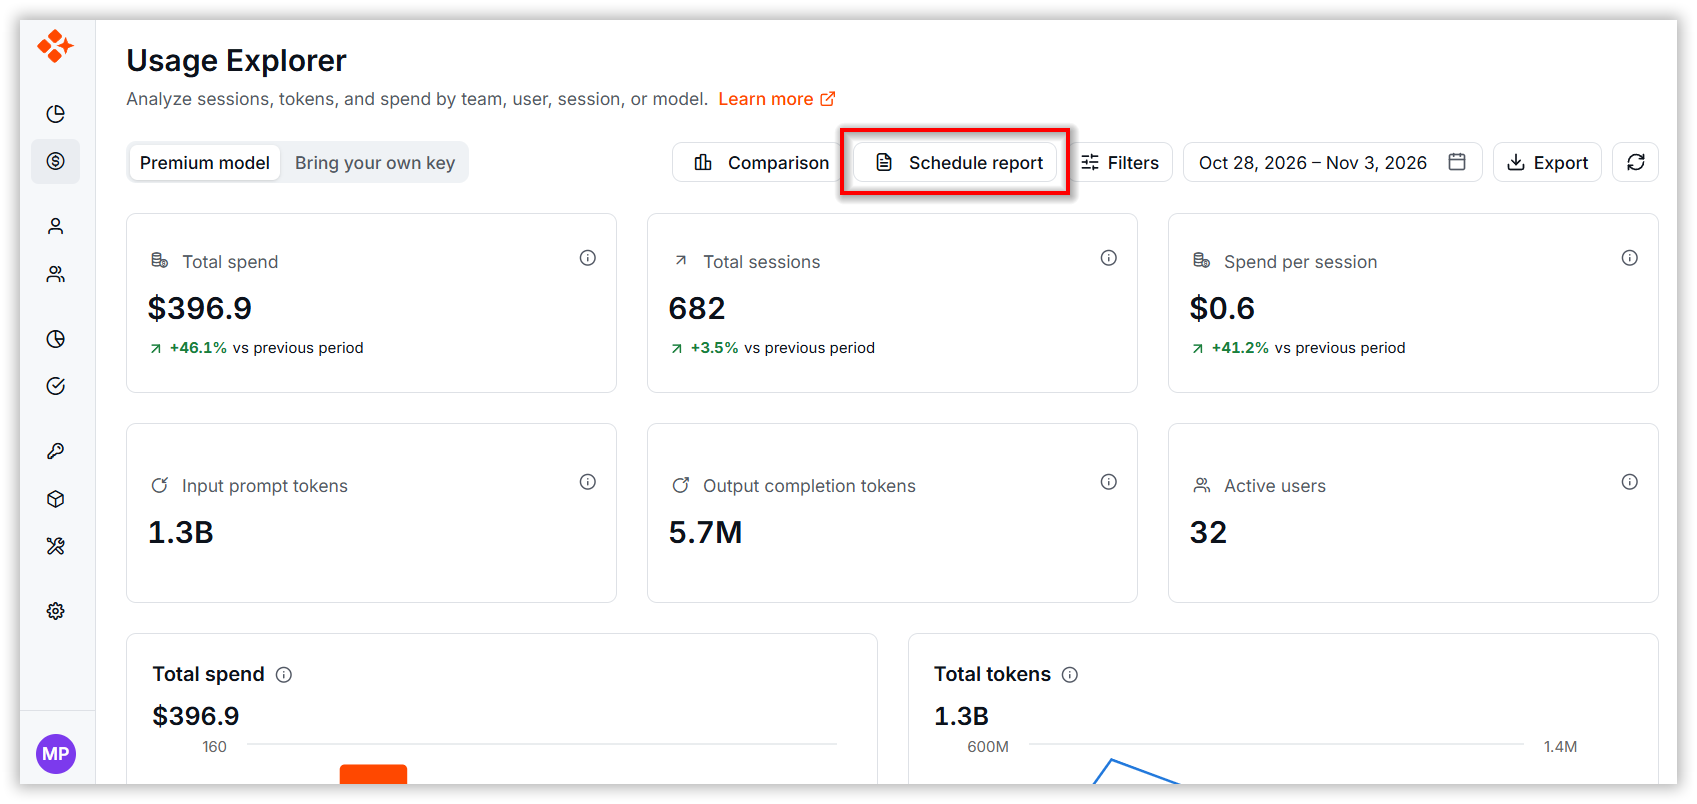
The Schedule Report feature enables users to automate the delivery of Usage Explorer reports. Instead of manually exporting usage and spending data, users can create recurring schedules that automatically generate and send reports to selected recipients at predefined intervals.
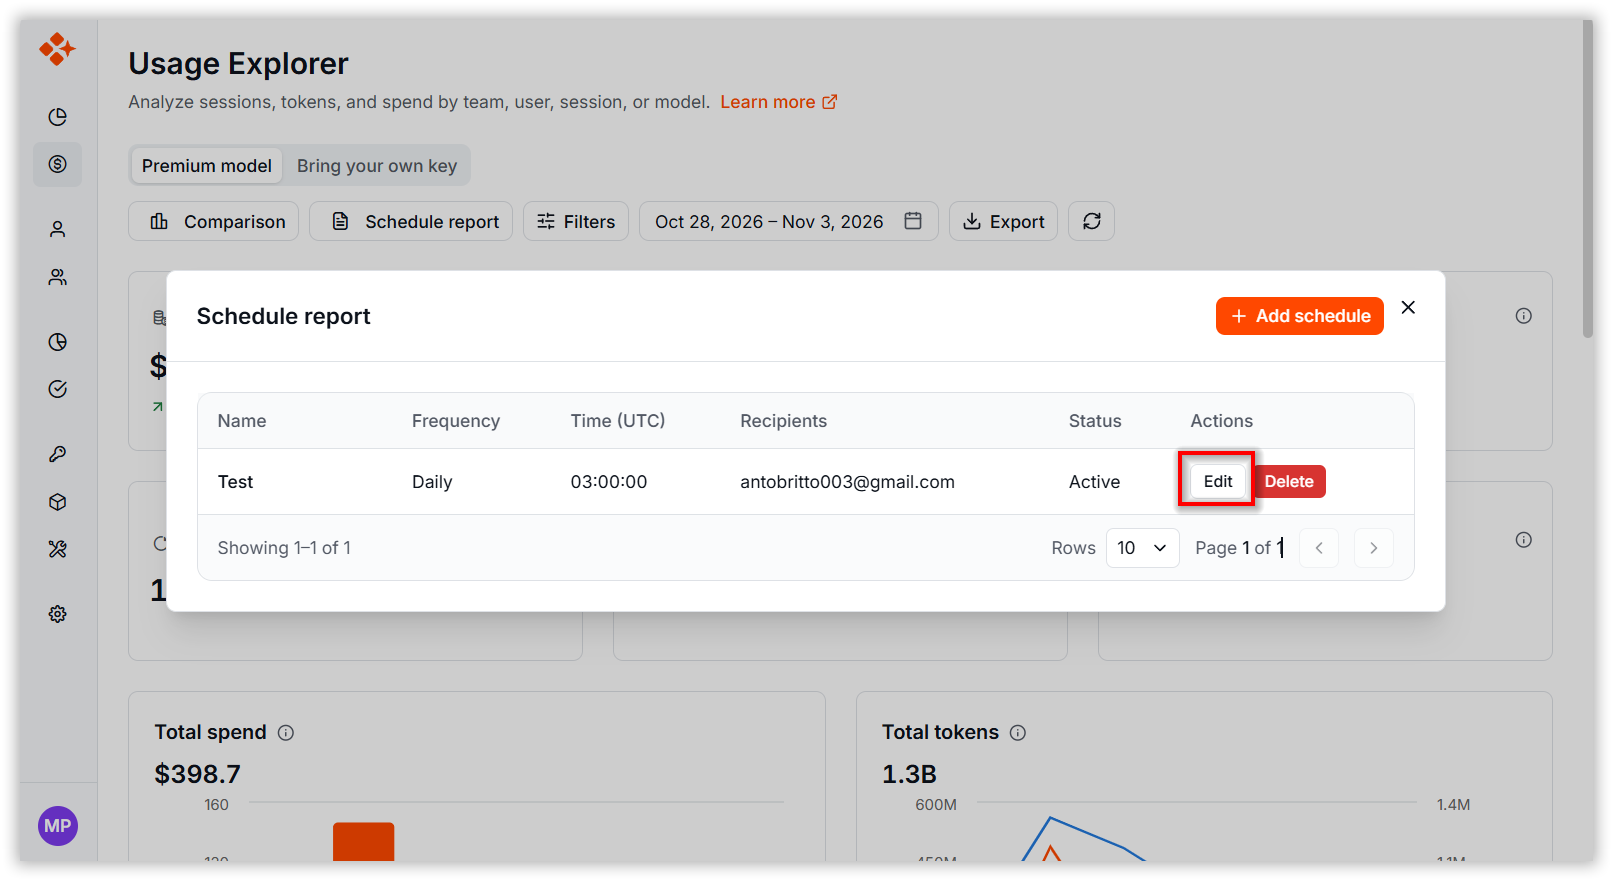
The Schedule Report screen provides a centralized view of all configured schedules, including:
- Name: Schedule name.
- Frequency: Daily, Weekly, or Monthly delivery frequency.
- Time (UTC): Scheduled report delivery time.
- Recipients: Users who receive the report.
- Status: Active or Paused.
- Action: To perform edit and delete schedule report.
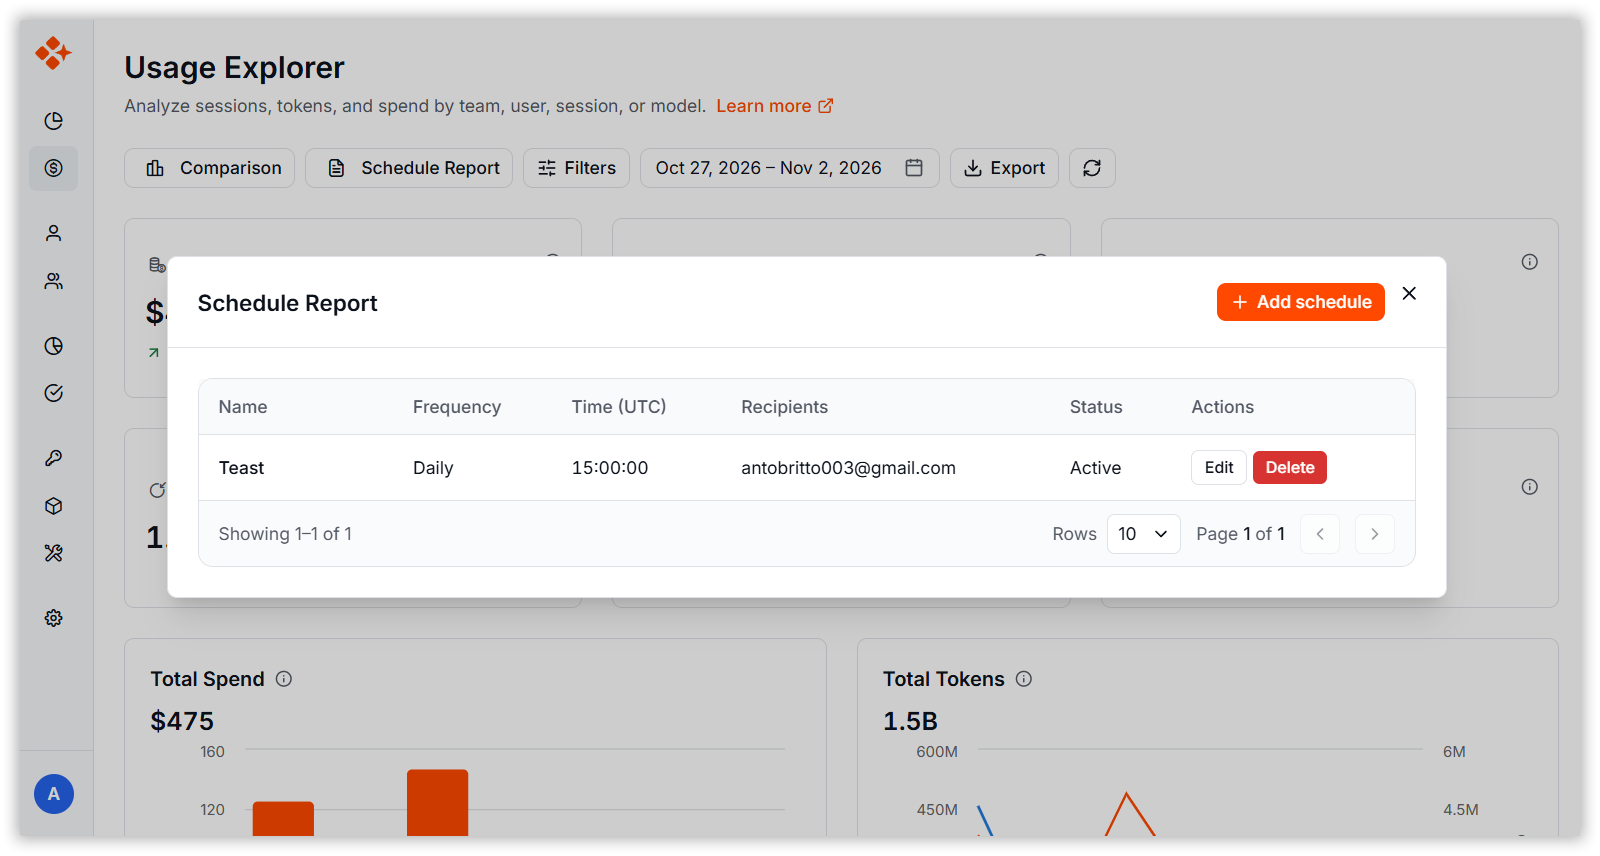
Note: The Schedule Report feature is available only for users with an active subscription plan. If your subscription plan has expired or you are using a plan that does not support scheduled reports, a warning dialog will be displayed when you attempt to create a new schedule. Please renew or upgrade your subscription to access and use the Schedule Report functionality.
7.1. How to Generate Schedule Reports
The Schedule Report feature allows users to automate the delivery of Usage Explorer reports to selected recipients at predefined intervals.
Note: Only Team Leads and Admins can create and manage Schedule Reports.
Steps to Create a New Schedule Report
- Click the Schedule Report button on the Usage Explorer page.
- Select Add Schedule Report.
- Enter a schedule name.
- Choose a delivery frequency (Daily, Weekly, or Monthly).
- Select one or more report recipients.
- Configure the report delivery time (UTC).
- Click Save schedule to save the schedule.
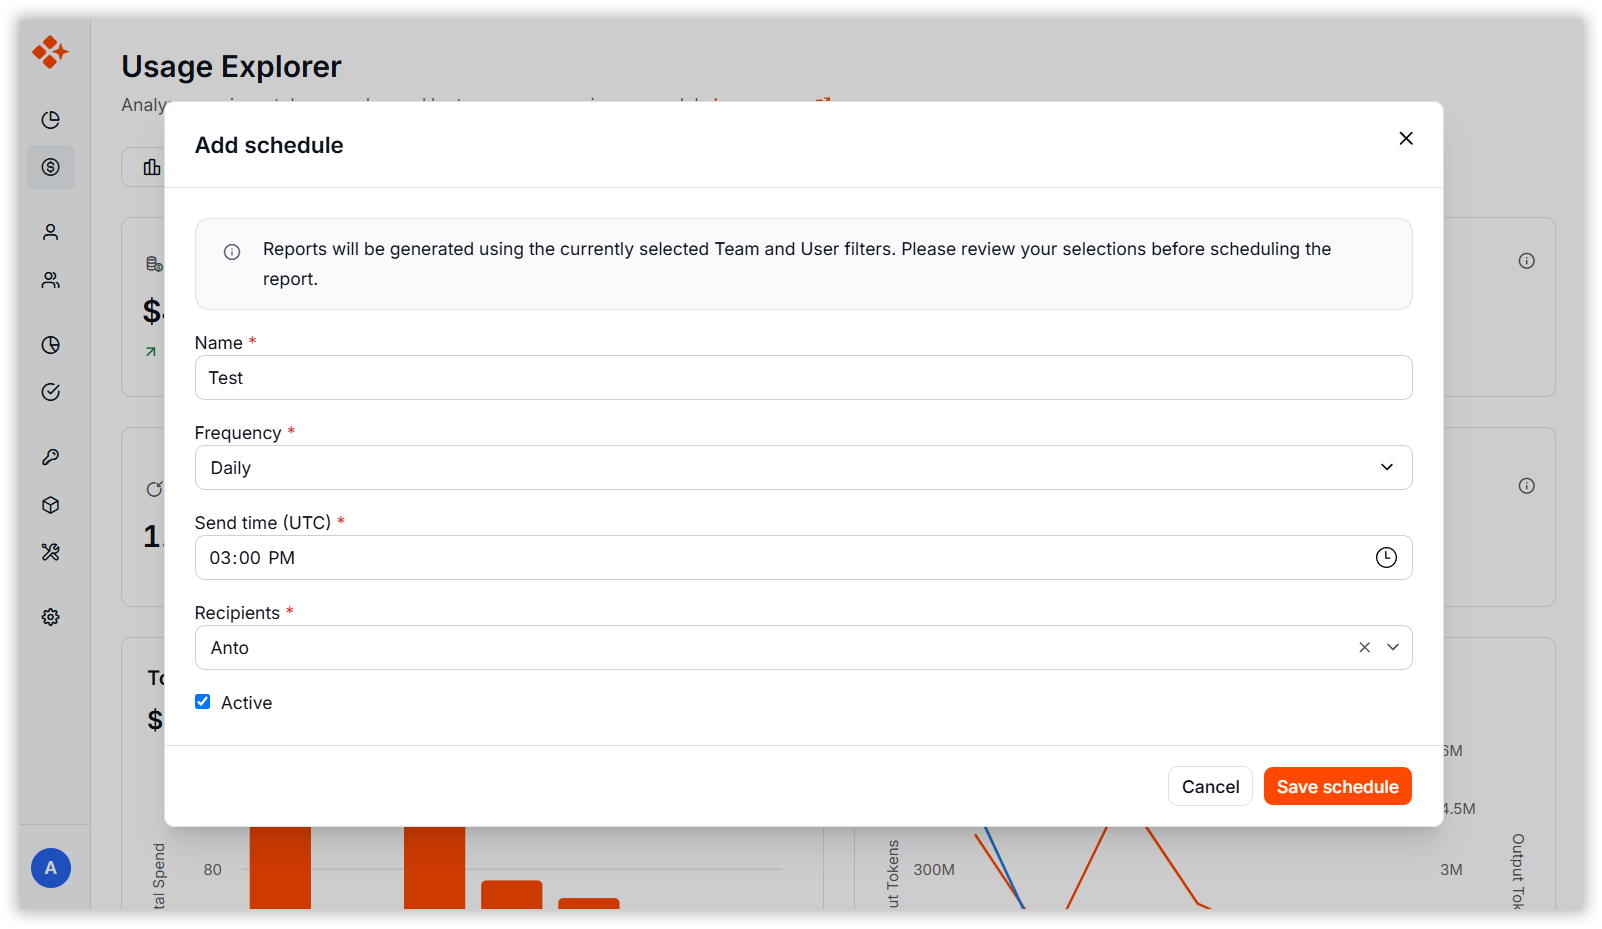
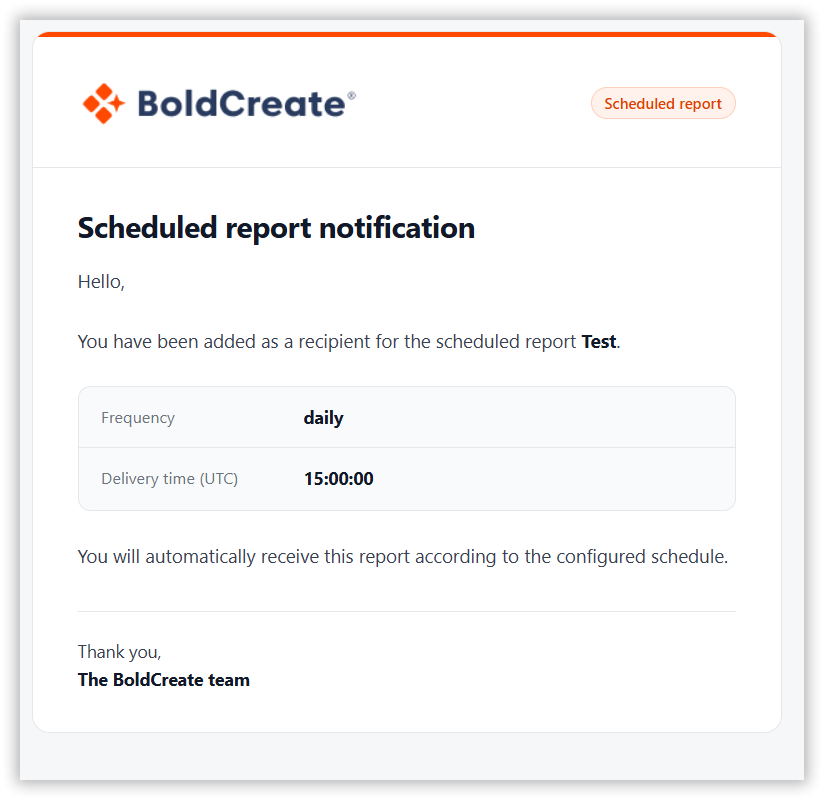
- Upon successful creation of a schedule, a notification email is sent to all selected recipients informing them that they have been added to the scheduled report.
- At the configured delivery time, the system automatically generates the Usage Explorer report and sends it via email to all configured recipients as an Excel attachment with the detailed Usage Explorer report.
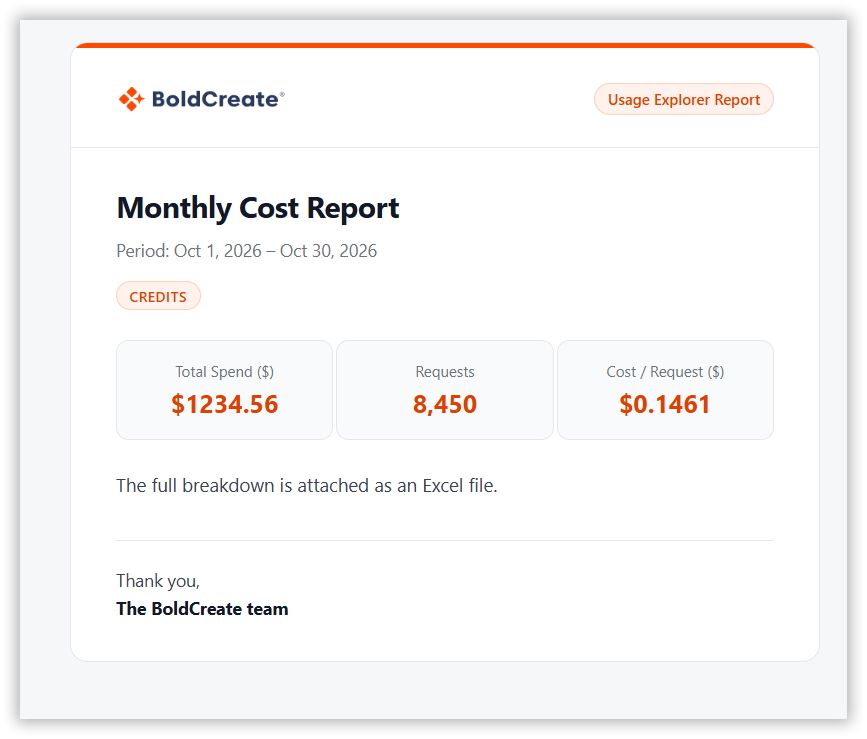
Note: The report will be generated and delivered automatically based on the configured schedule.
Steps to Edit a Schedule Report
- Click the Edit option in the action column to update the schedule report.
-
To Update the schedule details such as frequency, recipients, send time, or status.
-
Click Update schedule to save the changes.
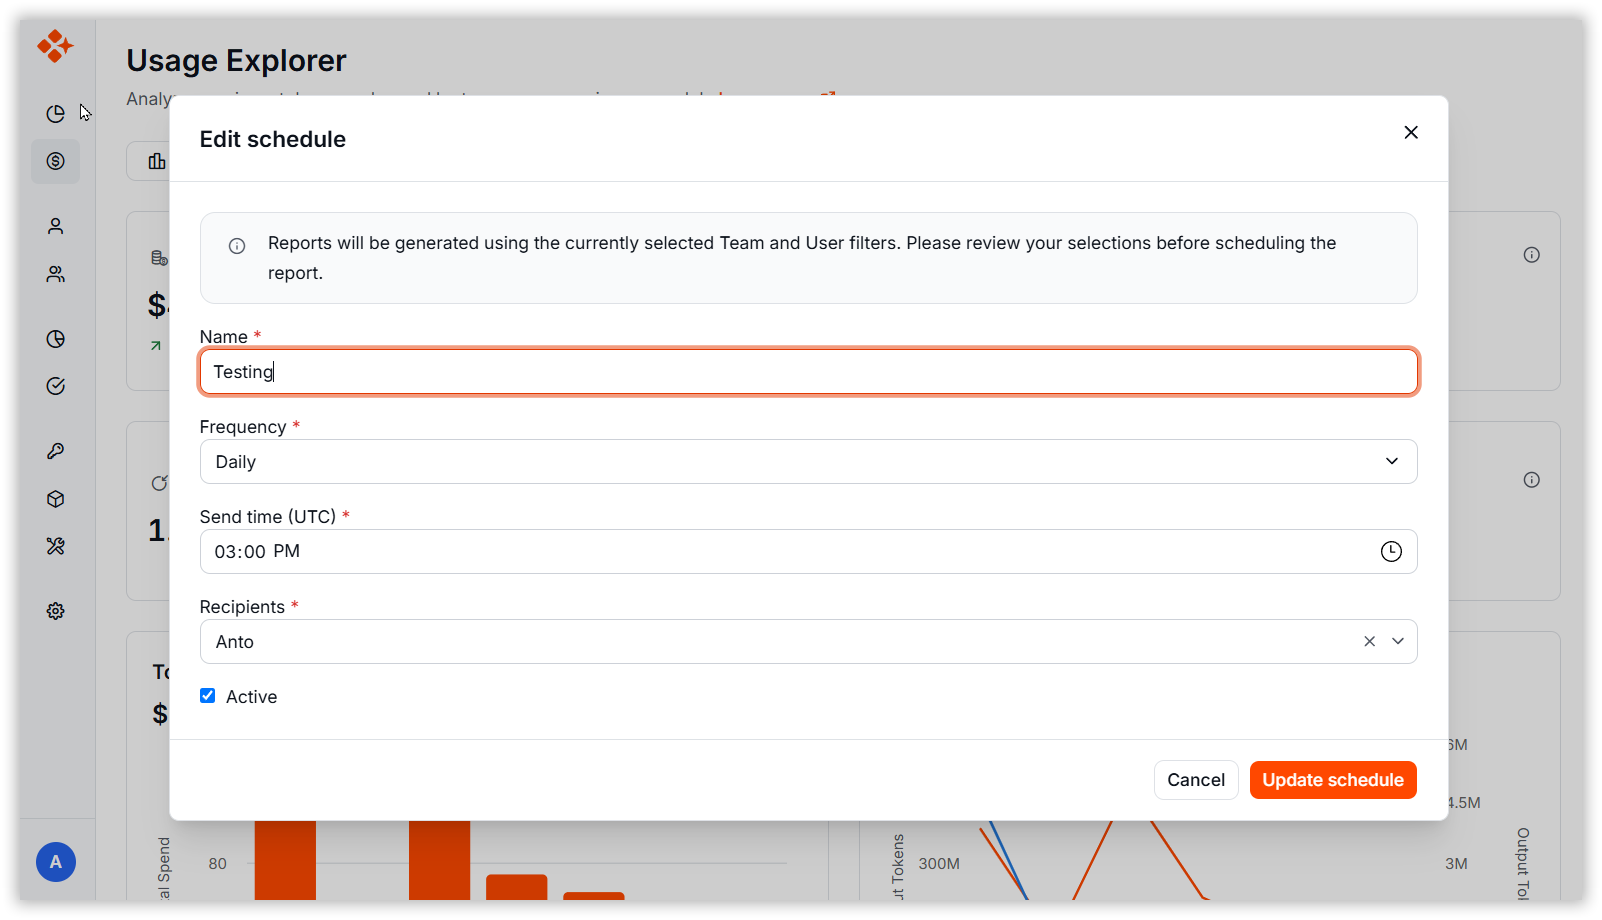
Note: The updated settings will be applied to future report deliveries.
Steps to Delete a Schedule Report
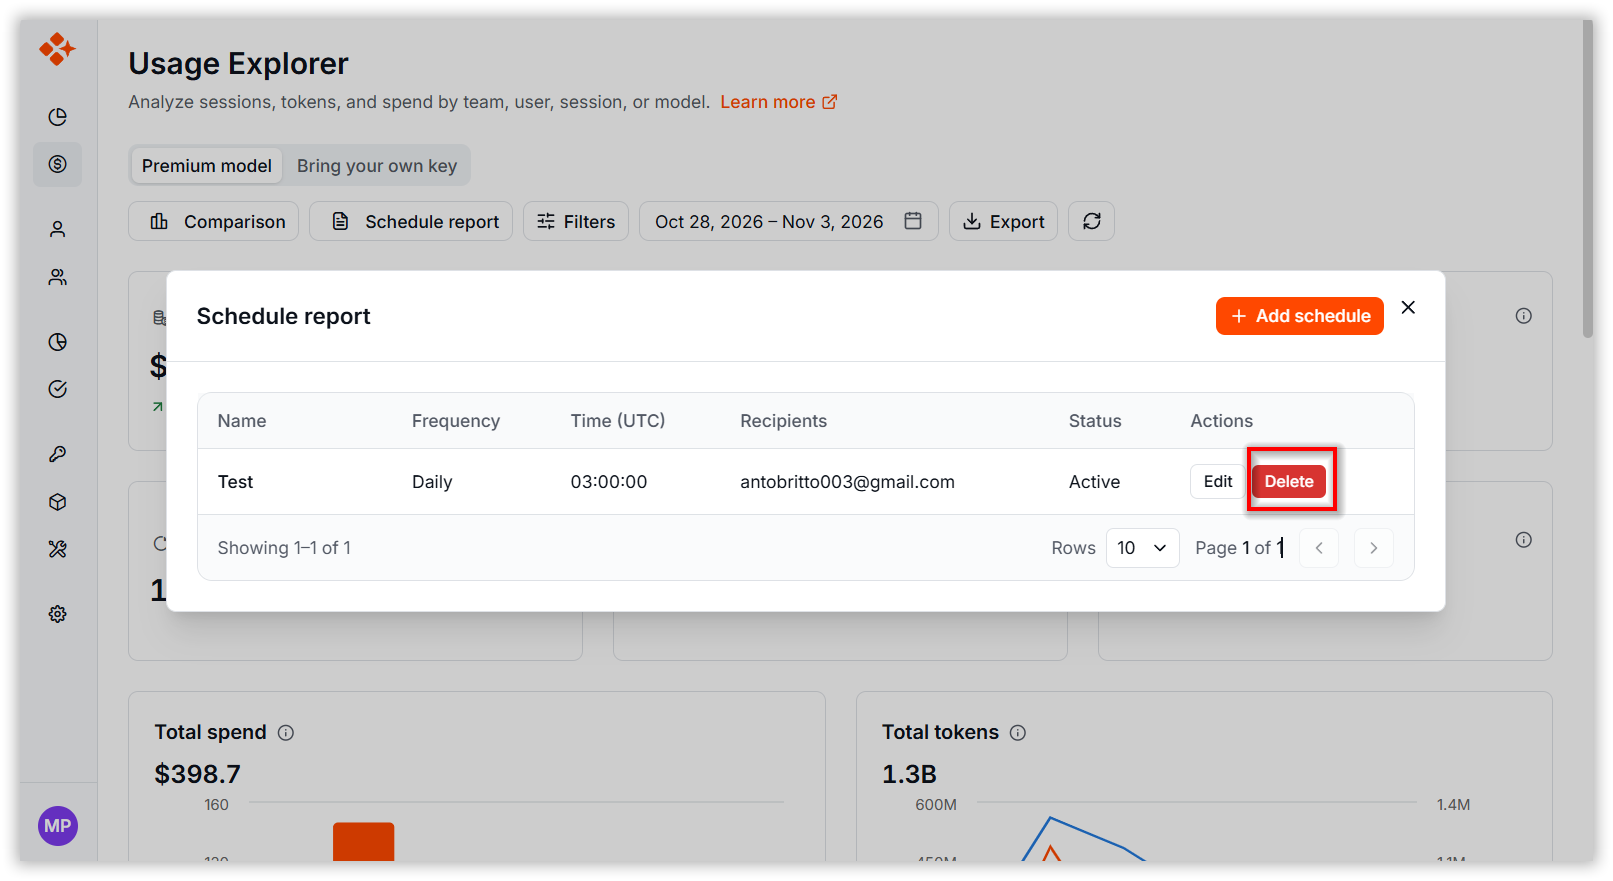
- Click the Delete option in the action column.
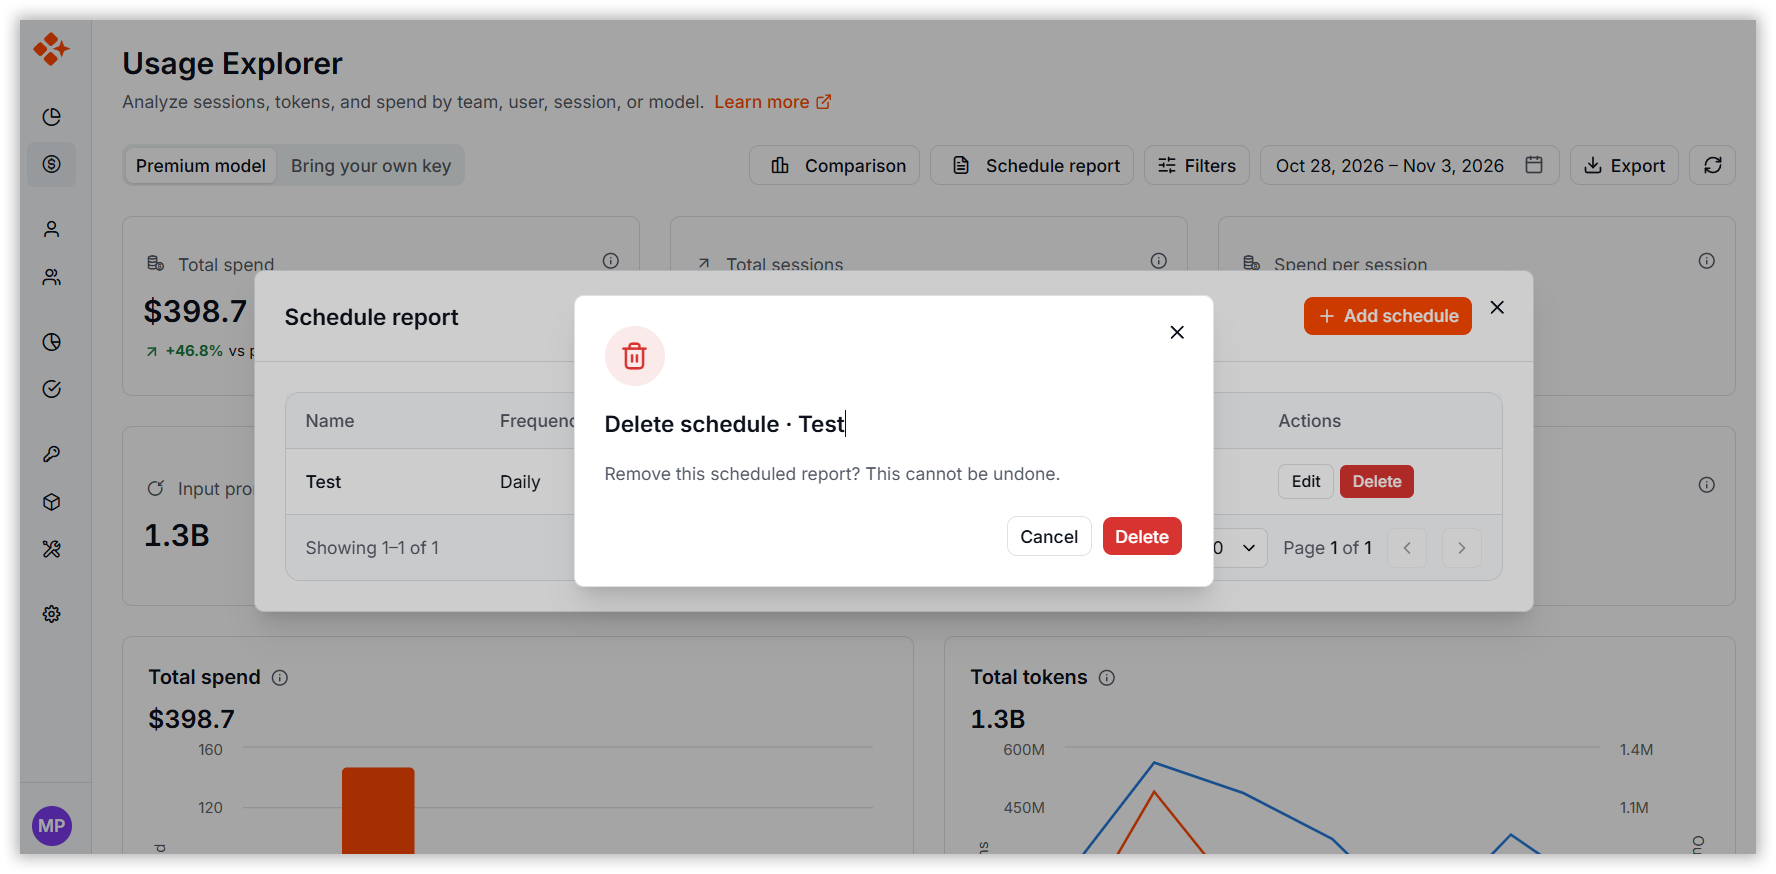
- Click Delete to delete the schedule report.
8. Export the Usage Explorer Report
- Click Export in the Usage Explorer.
- The system generates and downloads the report in Excel (.xlsx) format.
- The exported report includes all currently applied filters, such as date ranges and selected filters.
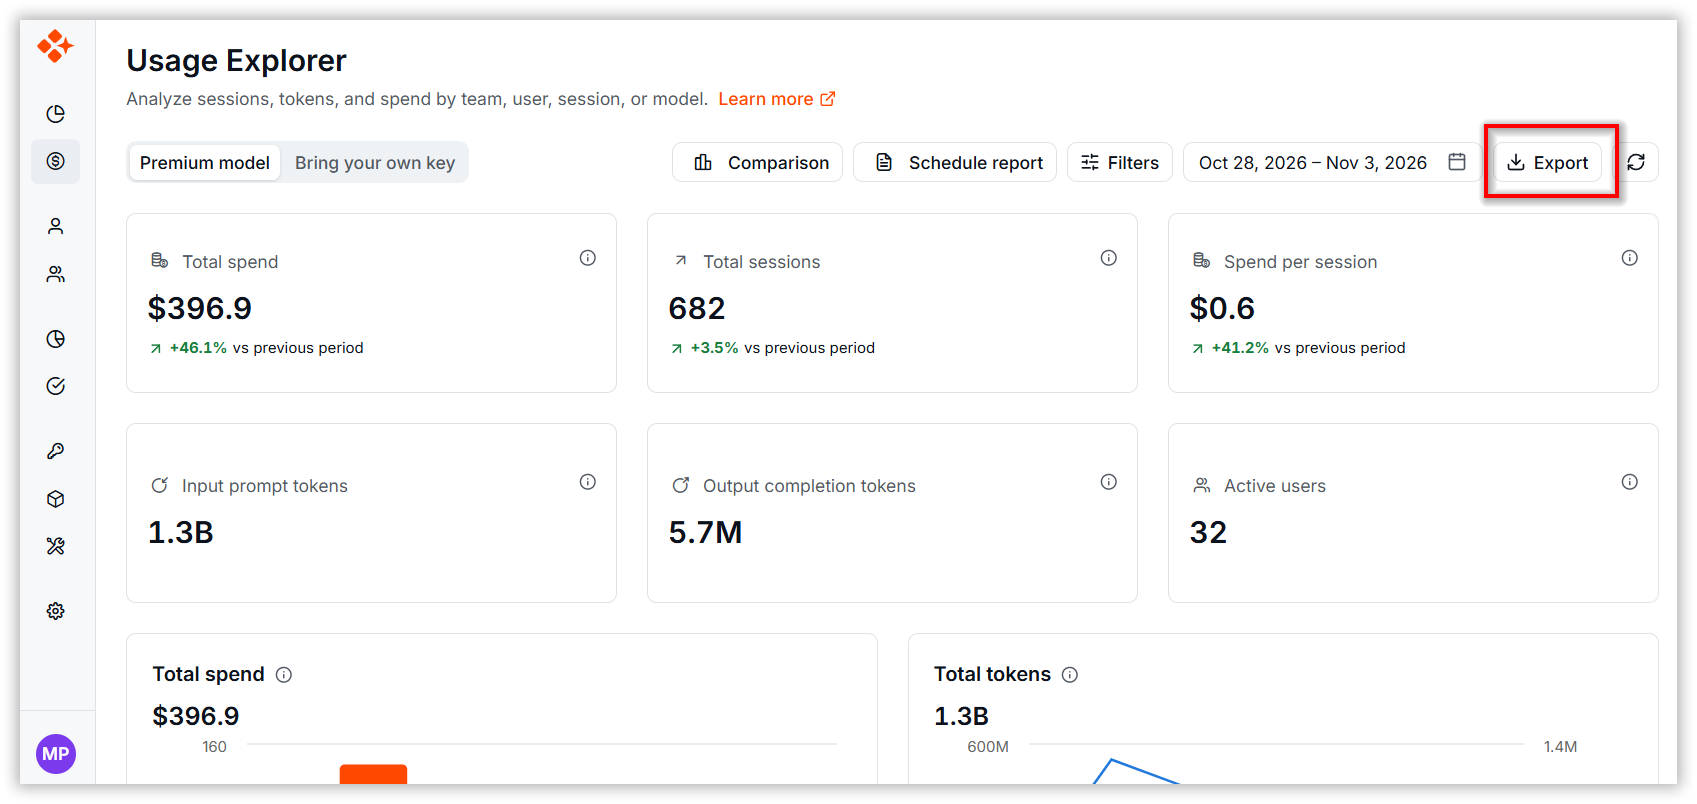
Note: Verify the selected filters and date range before exporting to ensure the report contains the required data.
9: View User and Session Details
-
Select the User view to display user-level usage analytics.
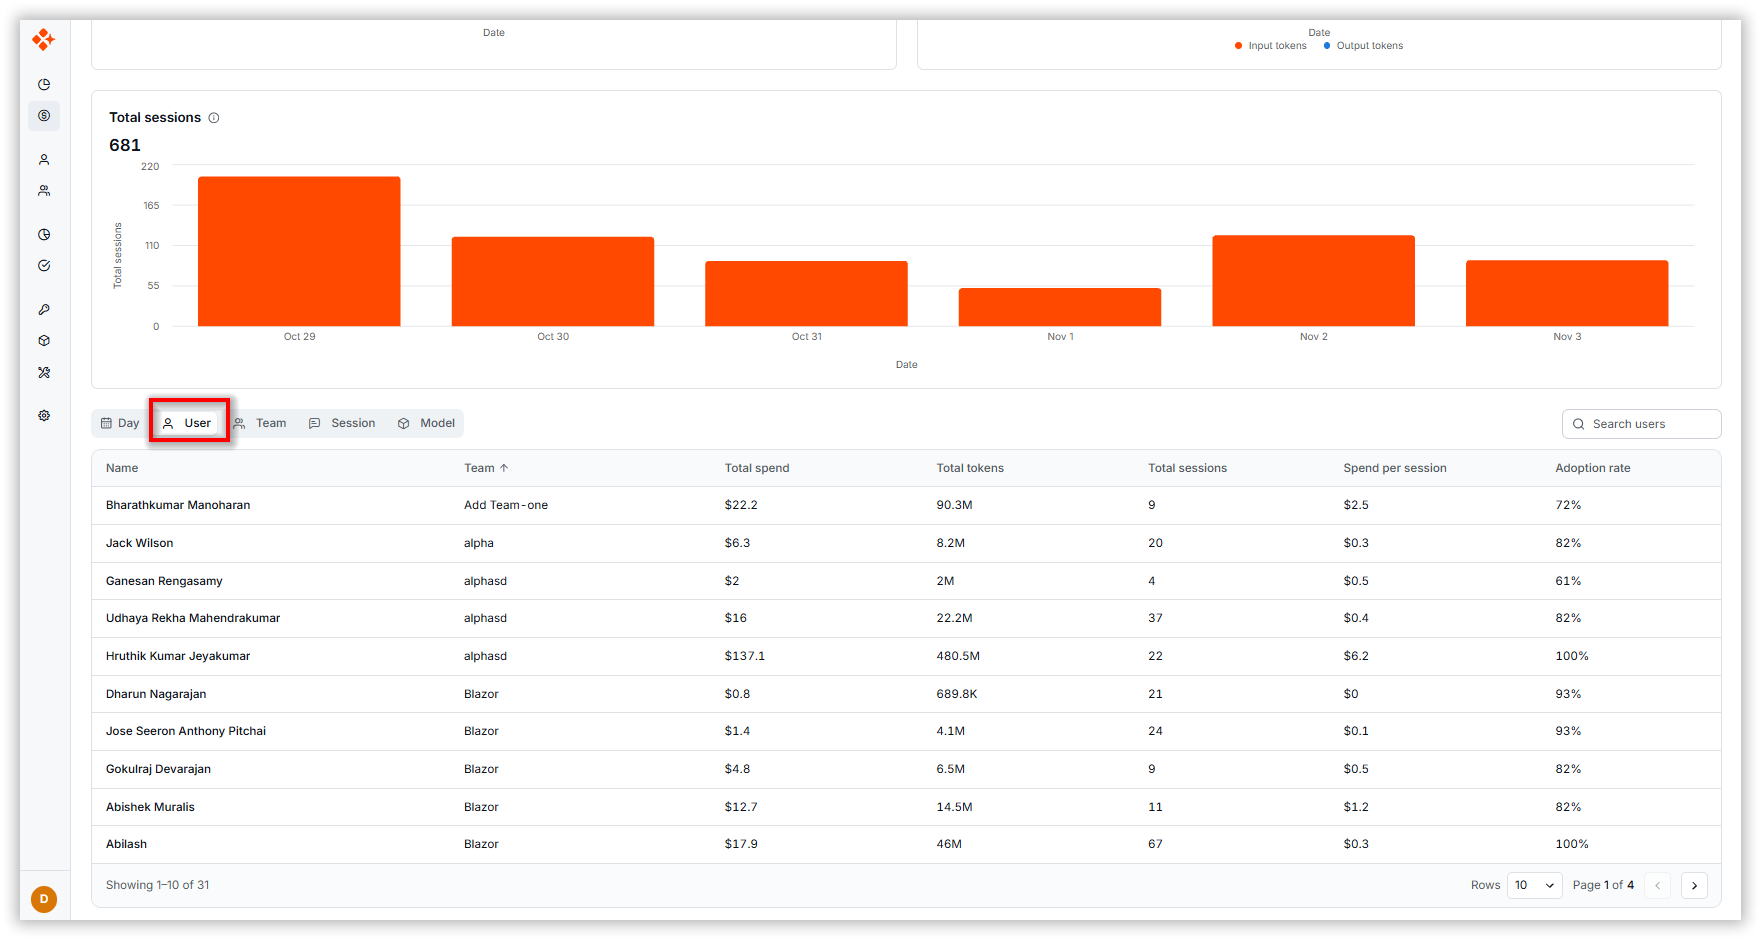
-
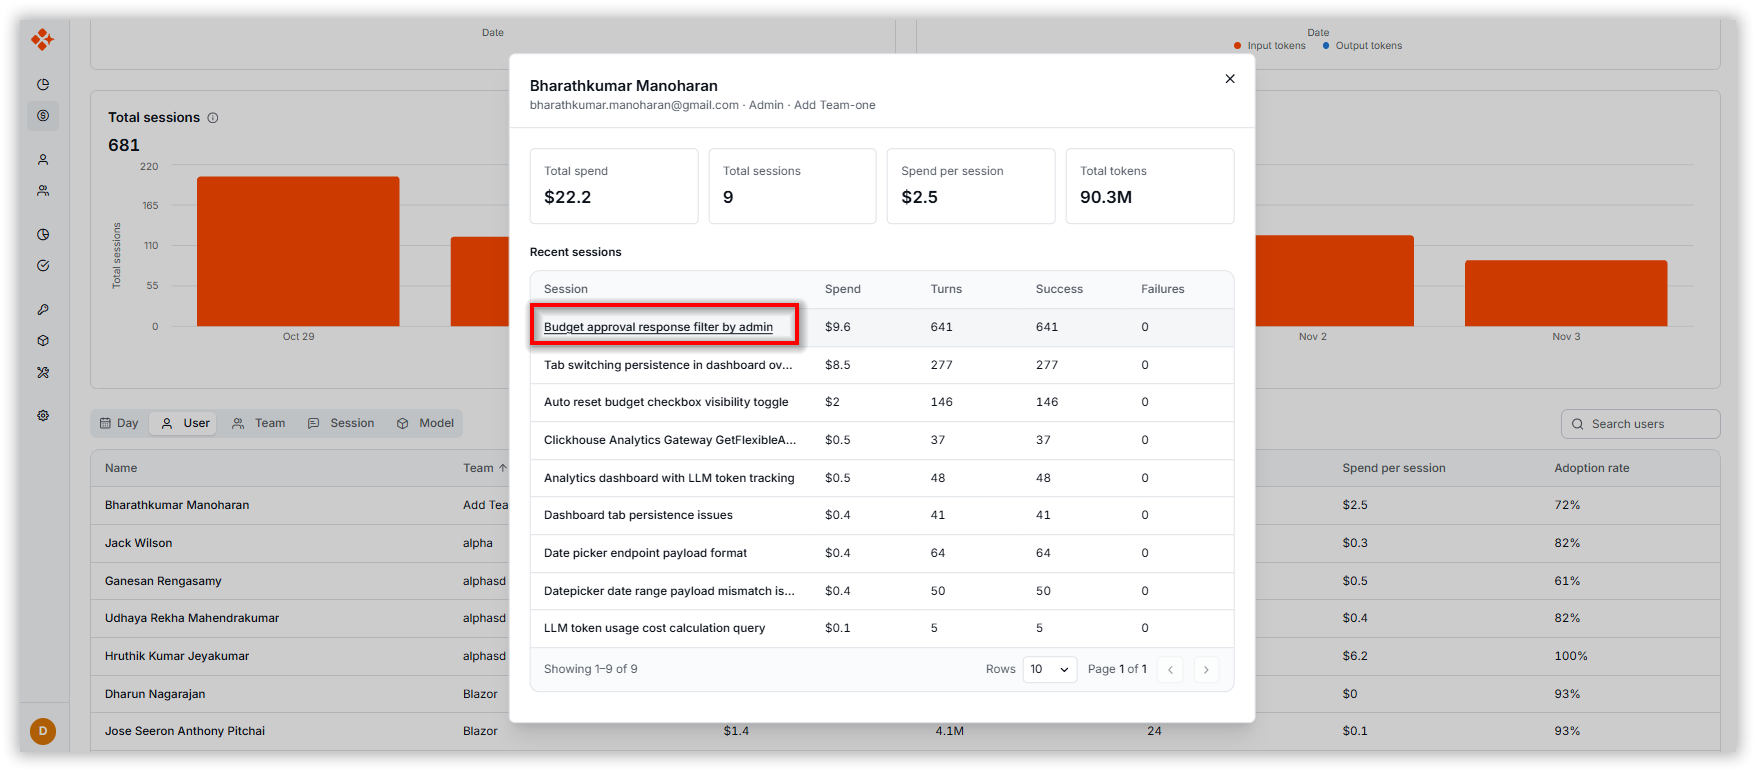
Click a user name to open the User Details dialog.
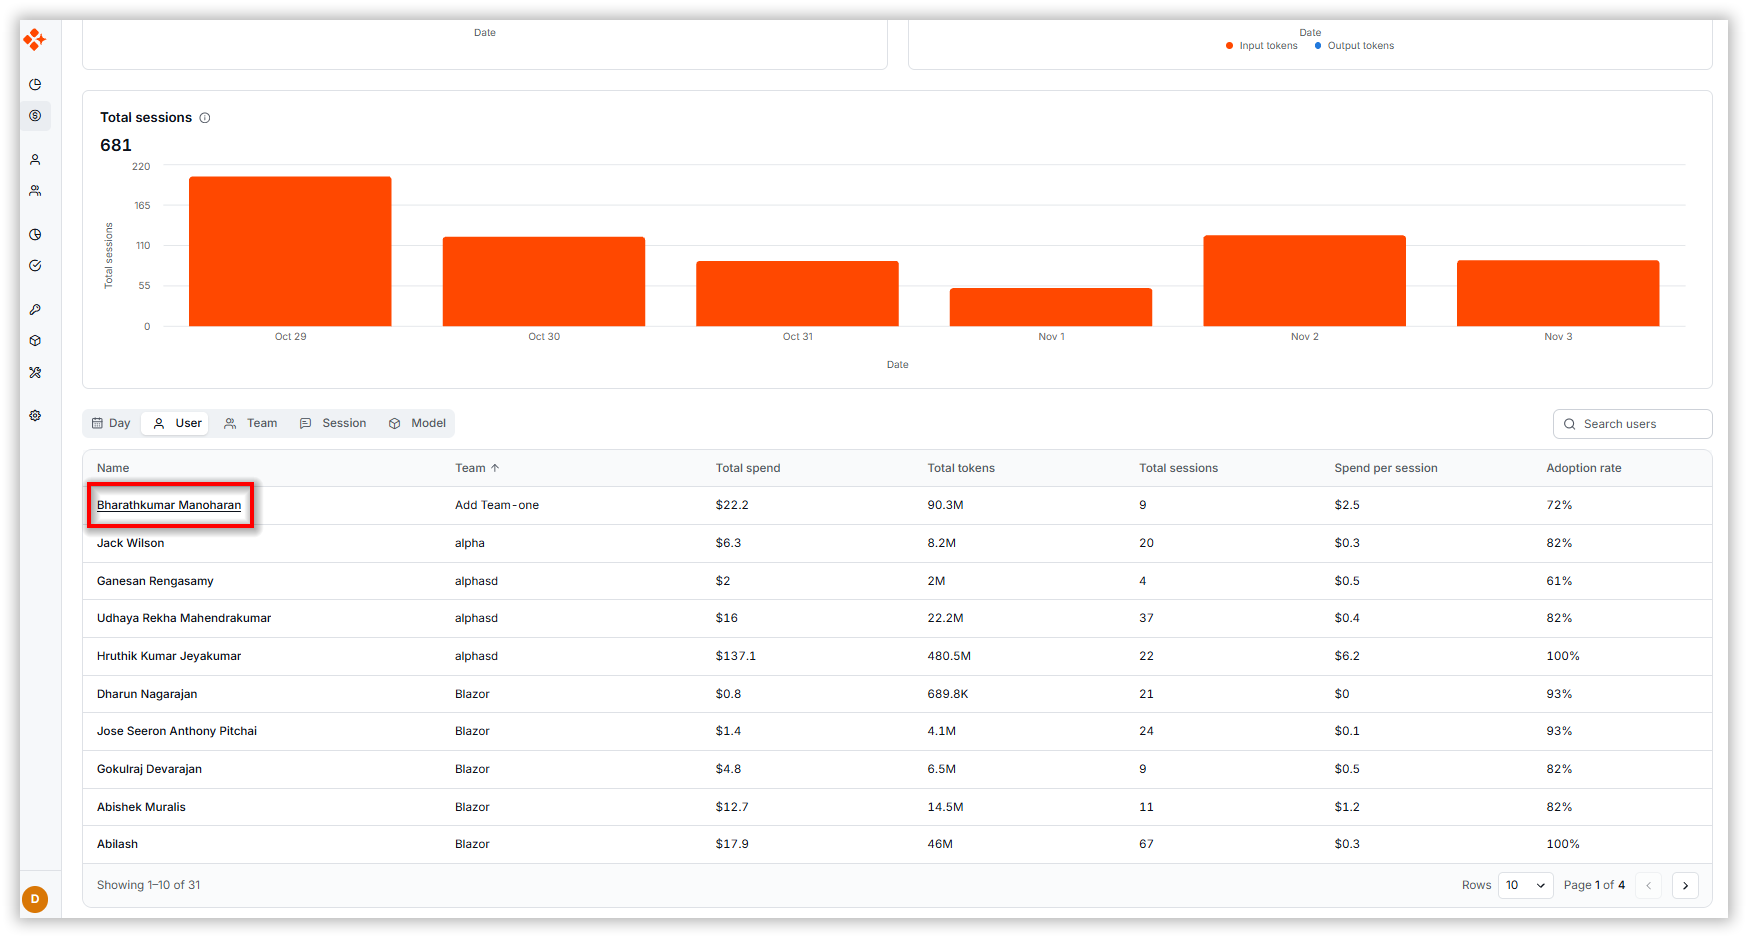
-
Review the user’s usage summary and recent sessions.
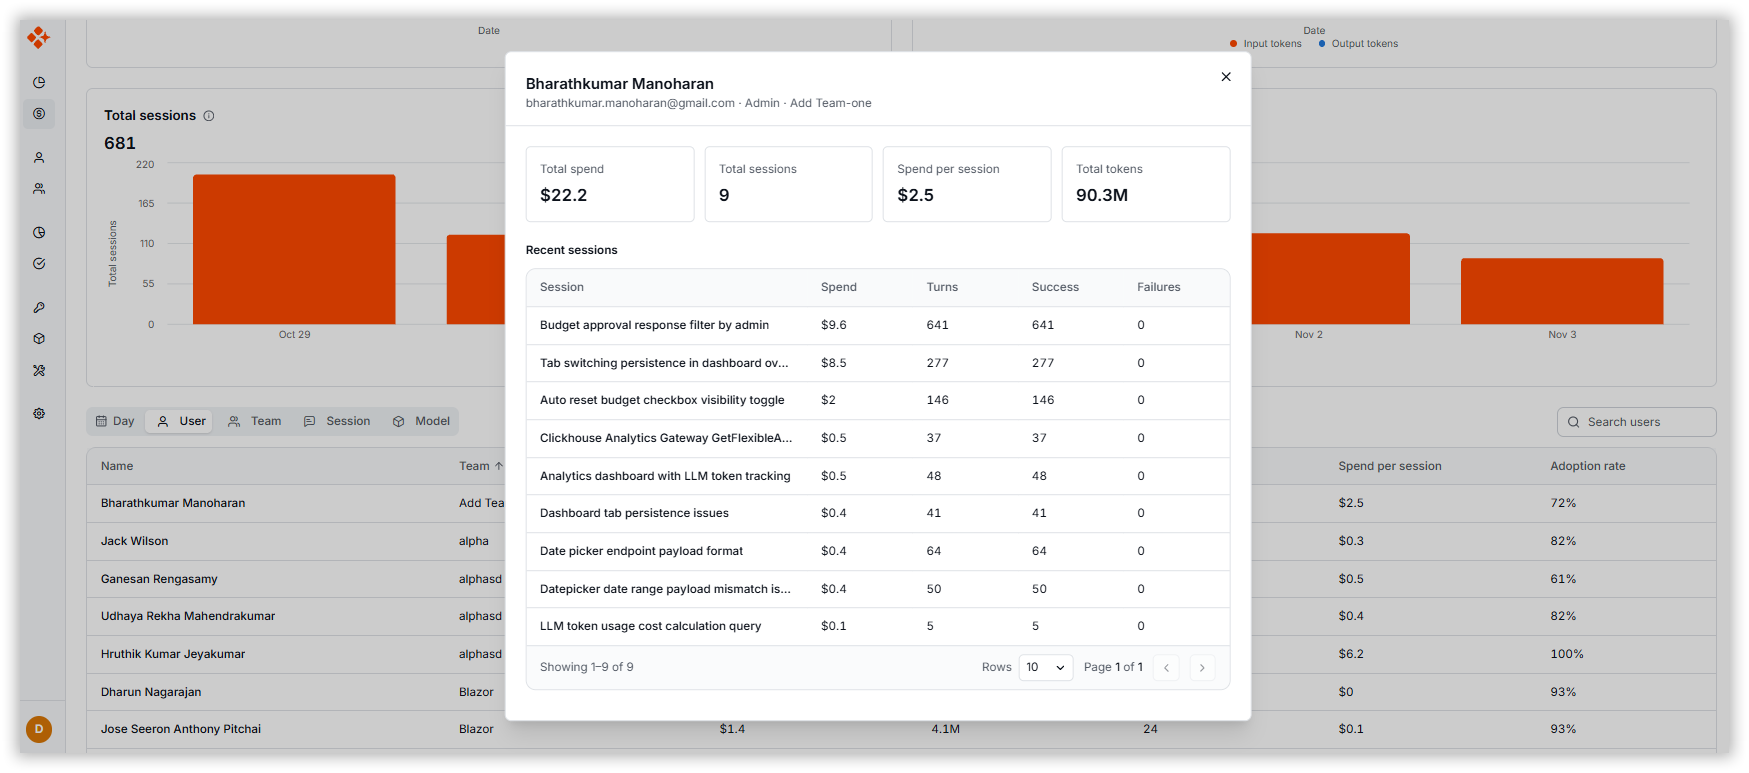
-
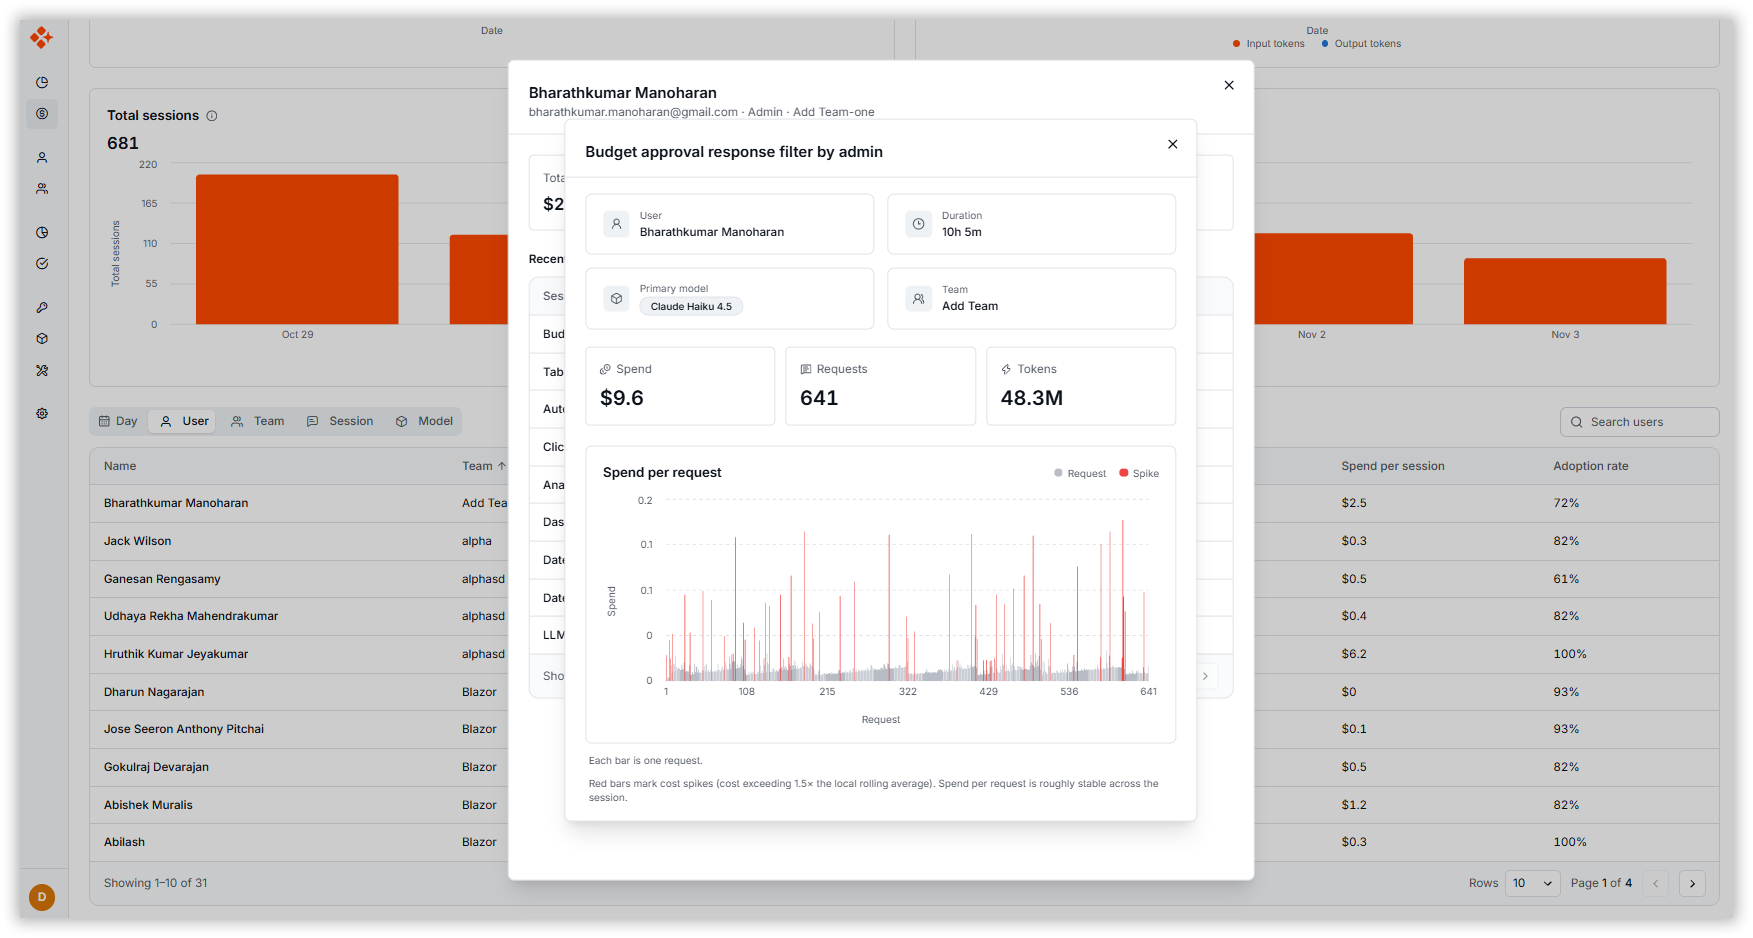
Click a session title within the User Details dialog to open the Session Details dialog.
-
Analyze session-specific metrics such as spend, requests, tokens, duration, and model usage.
10. How to Use Usage Explorer
Step 1: Navigate to Usage Explorer
- Navigate to Usage Explorer under Analytics.
- Select the Premium Model or Bring Your Own Key tab.
Step 2: Review Summary Metrics
- Review the summary cards displaying Total Spend, Total Sessions, Spend per Session, Input Prompt Tokens, Output Completion Tokens, and Active Users for the selected period.
- Observe the trend indicators on each card to see the percentage increase or decrease compared to the previous equivalent period.
- Review the comparison graphs to analyze changes in usage, user activity, and session trends over time.
Step 3: Apply Filters
The Usage Explorer Filter feature allows users to refine and analyze usage data with precision. It provides multiple filtering options to help you drill down into usage metrics across teams, users, sessions, and models.
Use the filter options to refine usage data:
- Team: Select one or more teams to view their aggregated usage metrics.
- User: Select a specific user or multiple users within the selected team to view detailed usage statistics.
- Platform Types: Filter usage by platform types
- Session: Filter by individual sessions to analyze session-level usage.
- Model: Select one or more AI models to analyze model-specific usage patterns.
The Usage Explorer automatically refreshes to display data based on the applied filters.
Step 4: Set Date Range
- Click the date selector to choose a start and end date.
- The Usage Explorer will refresh to show metrics for the selected period.
Step 5: Analyze Usage Data
Use the available views to analyze usage data from different perspectives:
- Select Day to review daily usage and spending trends.
- Select User to monitor individual user activity and consumption.
- Select Team to evaluate usage and adoption across teams.
- Select Session to review usage details for specific sessions.
- Select Model to analyze usage patterns across different models.
Step 6: View User and Session Details
- Select the User view to display user-level analytics.
- Click a user name to open the User Details dialog and review usage metrics and recent sessions.
- Click a session title within the User Details dialog to open the Session Details dialog.
- Review session-specific metrics such as spend, requests, tokens, duration, team, and model usage.
Step 7: Compare with Previous Period
- Click the Comparison in the Usage Explorer.
- Review KPI changes and spending trends.
- Analyze team-level differences.
Step 8: Generate Schedule Report
- Click the Schedule Report in the Usage Explorer.
- Automatically generate and deliver Usage Explorer reports to the specified recipients.
- Use scheduled reports to regularly monitor usage trends, spending, token consumption, and session activity without manually generating reports.
11. Best Practices
- Monitor Usage Regularly: Review Usage Explorer weekly to track consumption trends.
- Control Spending: Monitor credit and cost metrics to stay within budget.
- Track Adoption: Use team and user analytics to measure AI adoption.
- Optimize Usage: Identify high-cost users, teams, or models for optimization.
- Review Comparisons: Periodically compare current and previous usage periods to identify growth patterns.
- Automate Reporting: Schedule recurring reports for stakeholders to ensure continuous visibility into AI usage and spending.